Display Settings
Description: Sets grid diplay settings. Sub items of this menu are shown in Table 35.
Menu |
Description |
|---|---|
[Grid Shape] (S) |
Edits display settings on grid shape. |
[Node Attribute] (N) |
Edits display settings on grid node attribute. |
[Cell Attribute] (C) |
Edits display settings on grid cell attribute. |
[Set Up Scalarbar (U) |
Edits display settings on colorbar. |
[Grid Shape] (S)
Description: Set up display setting of grid shape.
When you select [Grid Shape], the [Grid Shape Display] dialog (Figure 366). Modify the setting and click on [OK]. Figure 367 shows an example of grid shape with Grid lines setting [Outline Only] and [All] respectively.
[Visible] checkbox in [Grid indices] group box is enabled only when [All] is selected in [Grid lines] group box.
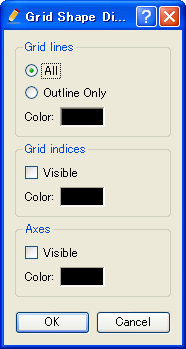
Figure 366 The [Grid Shape Display] dialog
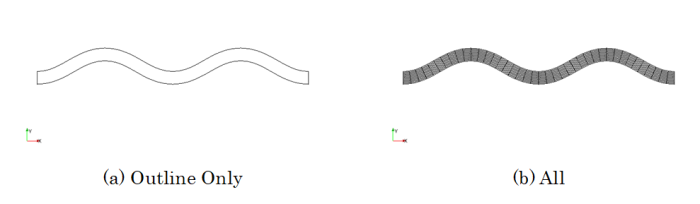
Figure 367 Example of grid shapes
Node Attribute (N)
Description: Sets up display setting of grid node attribute. This item is enabled only when a grid node attribute is selected in [Object Browser] of [Pre-processing Window].
When you select [Node Attribute], the [Grid Node Attribute Display Setting] dialog (Figure 368) will open. Modify the setting and click on [OK].
Please refer to sec_colormap about the dialog.
Figure 369 shows examples of displays on each mode.
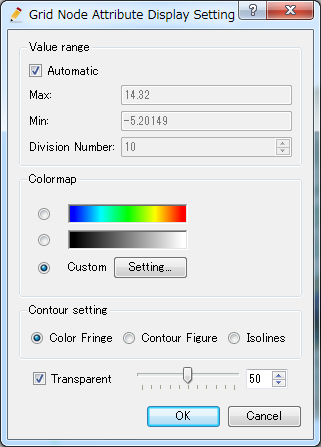
Figure 368 The [Grid Node Attribute Display Setting] dialog
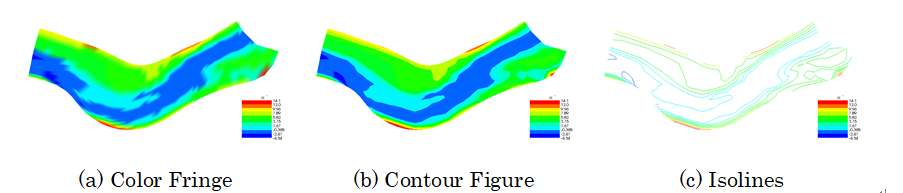
Figure 369 Examples of grid node attribute displays
Cell Attribute (C)
Description: Sets up display setting of grid cell attribute. This item is enabled only when a grid cell attribute is selected in [Object Browser] of [Pre-processing Window].
When you select [Cell Attribute], the [Grid Cell Attribute Display Setting] dialog (Figure 370) will open. Modify the setting and click on [OK].
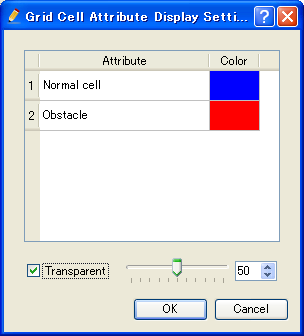
Figure 370 The [Grid Cell Attribute Display Setting] dialog