[Object Browser]
Figure 139 shows an example of the [Object Browser] of [Pre-processing Window].
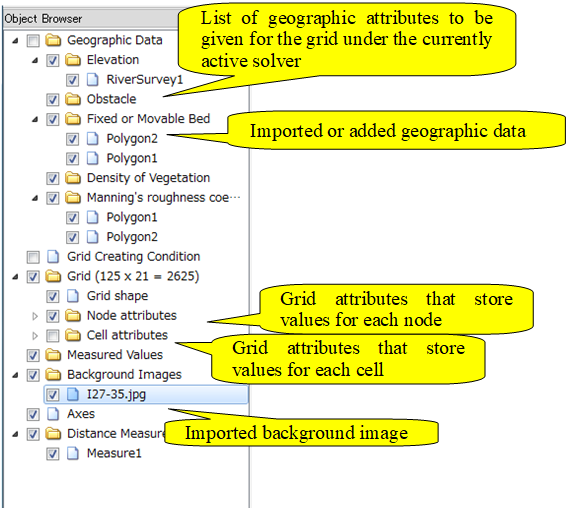
Figure 139 The [Object Browser] of the [Pre-processing Window]
Operations related to elements shown in object browser are explained in the following sections.
[Geographic Data]
[Geographic Data] is used when importing or editing geographic data that is used for grid attribute interpolation. Refer to [Geographic Data] for operations on [Geographic Data].
[Grid Creating Condition]
[Grid Creating Condition] is used when selecting and edit setting on grid creating condition. Refer to Grid creating functions for operations on [Grid Creating Condition].
[Grid]
[Grid] is used when editing grid. Refer to Grid for operations on [Grid].
[Measured Values]
[Measured Values] is used when importing measured values. Refer to [Measured Data] (M) for operations on [Measured Values].
[Background Images]
[Background Images] is used when importing background images. Refer to Background Image for operations on [Background Images].
[Background Images (Internet)]
[Background Images (Internet)] is used to show images got from internet and shows as background images.
When you check on the child item, like [Google Maps (Road)], the map is shown as background images.
When you want to use this function, you have to specify the coordinate system used in the project. Please refer to [Property] (P) about the way to specify the coordinate system.
You can add or remove the maps to show. When you want to use Google Maps images as background images, you need to create an account on Google, and input the API Key you’ve created. Please refer to [Background Images (Internet)] tab about the detail.
Note
Latitude and longtude coordinate systems
In iRIC 3.0.3 or later, you can use this function for Latitude and longitude coordinate systems, e. g. EPSG:4326 WGS 84.
[Axes]
Shows X-Y axes in the drawing region. Figure 140 shows the example of axes.
When [Axes] is selected in the [Object browser], you can change the position and size of the axes by mouse dragging operation in the drawing region.
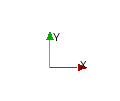
Figure 140 Example of axes
[Distance Measures]
Shows lines that is used to measure the distance in the drawing region.
You can add measures, by selecting [Distance Measures] in the [Object Browser], and selecting [Add Measure] in the right-clicking menu.
By selecting measure element (the child elements of [Distance Measures]), and left-dragging operation in the drawing region, you can draw a line that represents the distance between the drag start point and the drag end point. Figure 141 shows the example of the distance measure line.
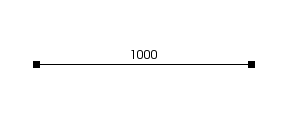
Figure 141 Example of the distance measure line
Line color, start position, and end position etc. of the distance measure line can be edited from the [Property] dialog. Figure 142 shows the example of [Distance Measure] property dialog.
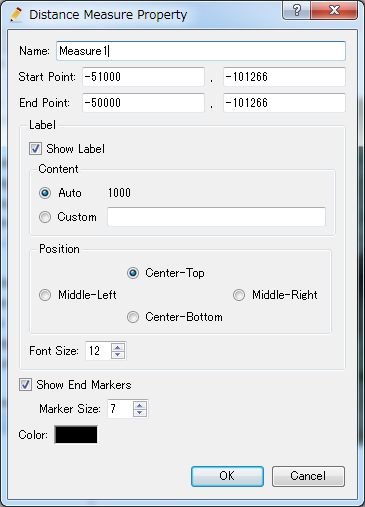
Figure 142 [Distance Measure] property dialog