[Measured Data] (M)
The functions for importing and displaying [Measured Data] are explained in the following sections. Refer to Loading measured data for the abstract of [Measured Data].
Operations related to [Measured Data] are available from [Measured Data] menu when the [Pre-processing Window] or [Post-Processing (2D)] Window is active.
Measured Data consists of the positions of measured data, and measured values (scalar values and vector values). Figure 376 shows an example of measured data shown in [Object Browser].
Refer to [Scalar] (S) for display setting of scalar values, [Arrows] (A) for vector values.
For importing [Measured Data], refer to [Measured Data] (M).
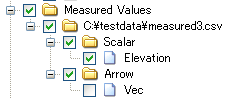
Figure 376 Example of imported Measured Values on [Object Browser]
[Scalar] (S)
Description: Sets the display setting of scalar values
When you select this, the [Scalar Setting] dialog (Figure 377) will open. Set the display setting of scalar values and click on [OK].
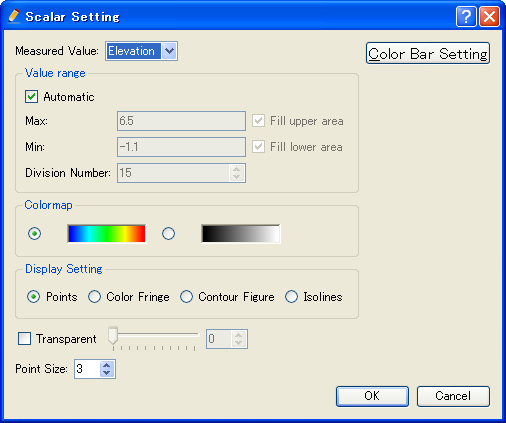
Figure 377 Example of [Scalar Setting] dialog
[Arrows] (A)
Description: Sets the display setting of arrows for vector values
When you select this, the [Arrow Setting] dialog (Figure 378) will open. Set the arrow display setting and click on [OK].
Figure 378 Example of [Arrow Setting] dialog
[Import] (I)
Description: Imports measured data from CSV file.
The function of this item is the same to [Measure Data] under [Import] menu under [File] menu. Refer to [Measured Data] (M).