[Create grid from River Survey Data] (1-D structured grid)
Description: Creates a grid from River Survey Data. In addition to the center point of transverse lines being set, division points are set on the transverse lines, the river centerline and left/right bank lines. Each node holds cross-sectional information. Figure 325 shows an example of a grid created by this algorithm.
Before using this algorithm, you need to import River Survey Data.
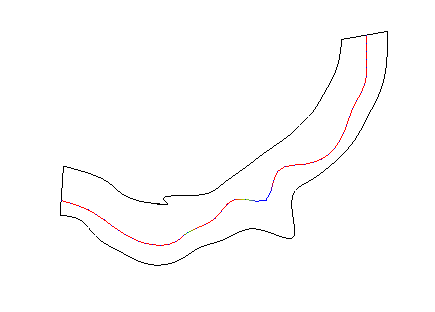
Figure 325 Example of a grid created from River Survey Data
When you select this, in River Survey Data, the nodes are made on the river center points and on the division points that have been added to the river centerline. When division points are added, the cross-sectional shape data of nodes created on the division points are automatically created from adjoining river transverse line data.
Select [Grid Creation] from the menu. The [Grid Creation] dialog (Figure 326) will open. Specify the region where the grid is to be made and click on [OK]. The grid is generated according to the division points. Manipulation of division points is done from the menu shown in Menu items.
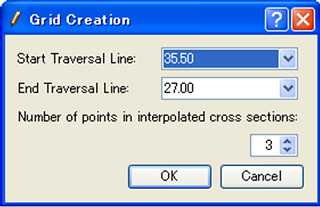
Figure 326 The [Grid Creation] dialog
[Add Division Points] (A)
Description: Adds division points to the selected line.
Select the line to which you want to add division points (e.g., river centerline) by clicking on it. Figure 327 shows an example of the display after selecting a line. Then, select [Add Division Points] from the menu. The [Add Division Point] dialog (Figure 328) will open. Input the number of divisions, select the division method, and click on [OK]. Division points are added to the line (Figure 329).
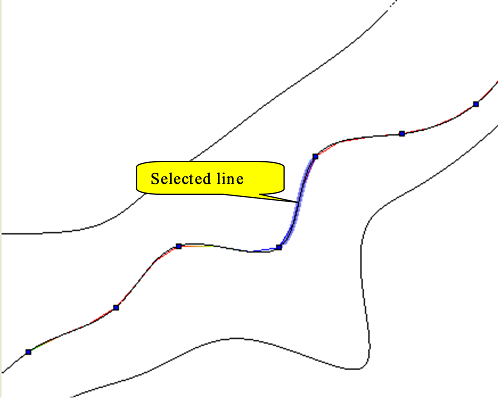
Figure 327 Example of a selected line

Figure 328 The [Add Division Points] dialog
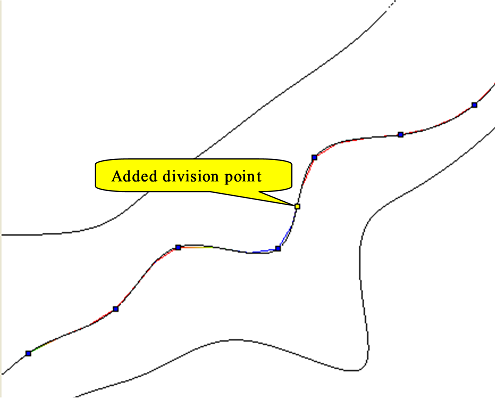
Figure 329 Example of the display after division points have been added
[Add Division Points Regionally] (R)
Description: Simultaneously adds division points on several river centerlines.
When this is selected, the [Add Division Point Regionally] dialog (Figure 330) will open. Set the area where division points are added to centerlines and the number of divisions, and click on [OK].
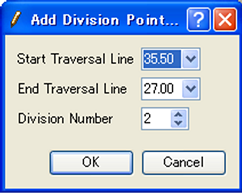
Figure 330 The [Add Division Points Regionally] dialog
[Remove Division Points] (D)
Description: Deletes the selected division points. Figure 331 shows an example.

Figure 331 Example of deleting division points
[Move Division Points] (M)
Description: Moves the selected division point. This is possible when selecting continuous division points on the same line.
When this is selected, the [Move Division Points] dialog (Figure 332) will open. Set [Transfer Quality] and click on [OK].
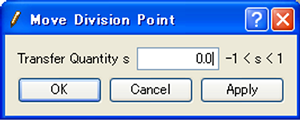
Figure 332 The [Move Division Points] dialog
[Reposition Division Points] (P)
Description: Relocates the selected division points. This is possible when selecting continuous division points on the same line.
When this is selected, the [Reposition Division Point] dialog (Figure 333) will open. Select [Reposition Method] and click on [OK].
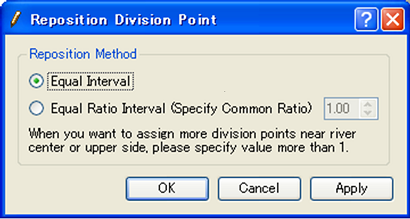
Figure 333 [Reposition Division Point] dialog