[Create grid shape solving Poisson equation]
Create grids by solving poisson equation to region which is defined by [Center line], [Left bank line], and [Right bank line].
Grids generated by this algorithm consists of cells that are similar to square, so it helps solvers do stable simulations.
Figure 293 shows an example of a grid created by this algorithm.
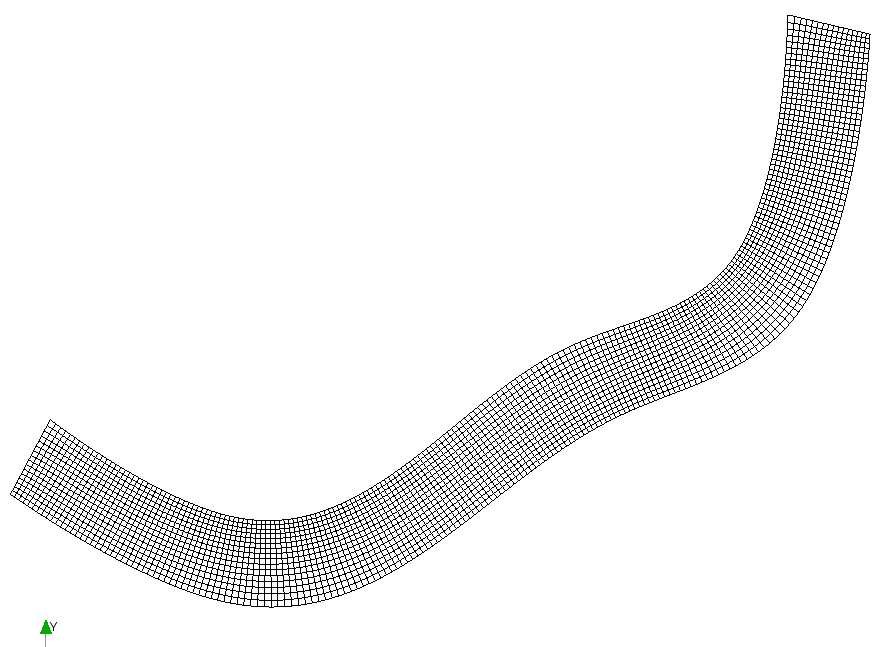
Figure 293 Example of a grid created by solving Poisson equation
When this algorithm is selected, if a river survey data is imported, The dialog in Figure 294 is shown.
When you specify the number of Control Cross Sections and click on [OK] button, center line is defined by using the river center lines of river survey data, as shown in Figure 295.
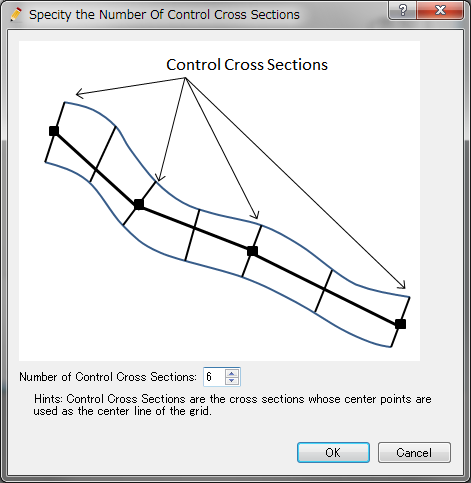
Figure 294 [Specify the Number of Control Cross Sections] dialog
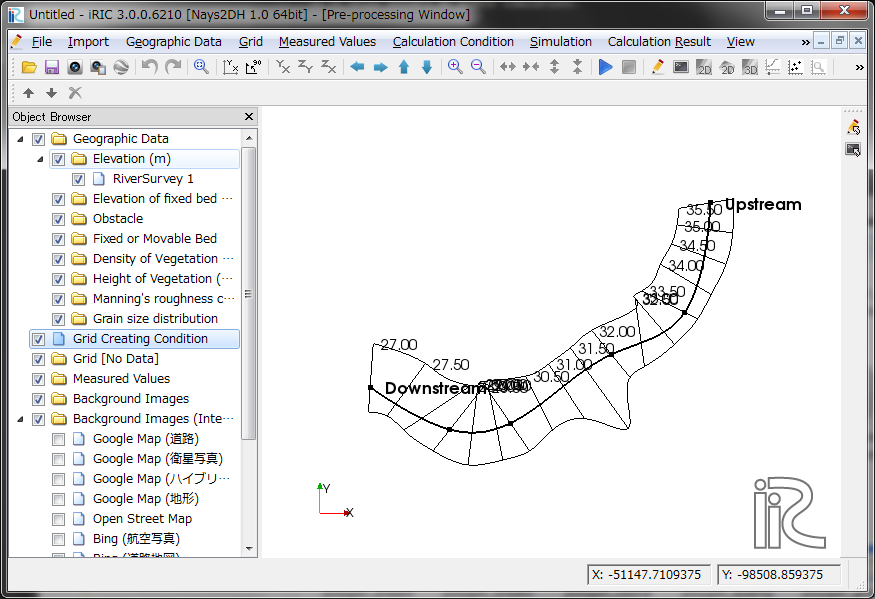
Figure 295 Example of center line
Next, please generate left bank line and right bank line. Select [Build Left bank and Right bank lines] from menu. [Build Bank Lines] dialog (Figure 296) will be shown. When you input the distance on the dialog and click on [OK], Left bank line and Right bank line are generated, and shown like in Figure 297.
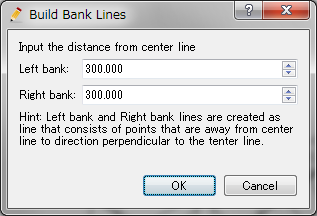
Figure 296 [Build Bank Lines] dialog
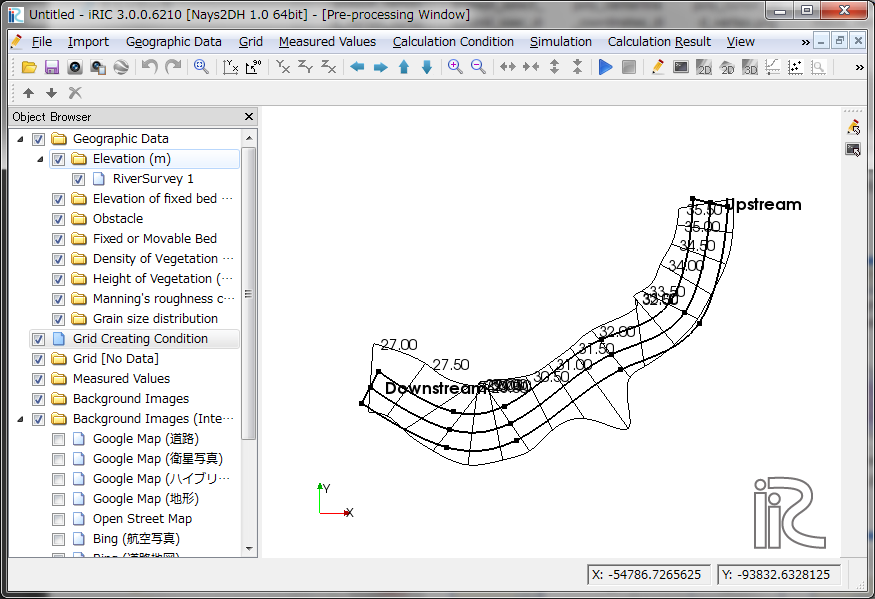
Figure 297 Example of generated Left bank line and Right bank line
Center line, Left bank line, Right bank line can be imported from Shape files or CSV files.
At last, select [Create Grid] from menu. [Grid Creation] dialog (Figure 298) will be shown.
When you input the number of division, and Maximum number of iteration on the dialog, and click on [OK], the grid is generated.
An example of generated grid is shown in Figure 299.
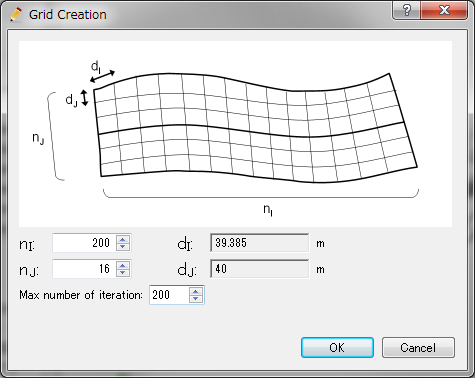
Figure 298 [Grid Creation] dialog
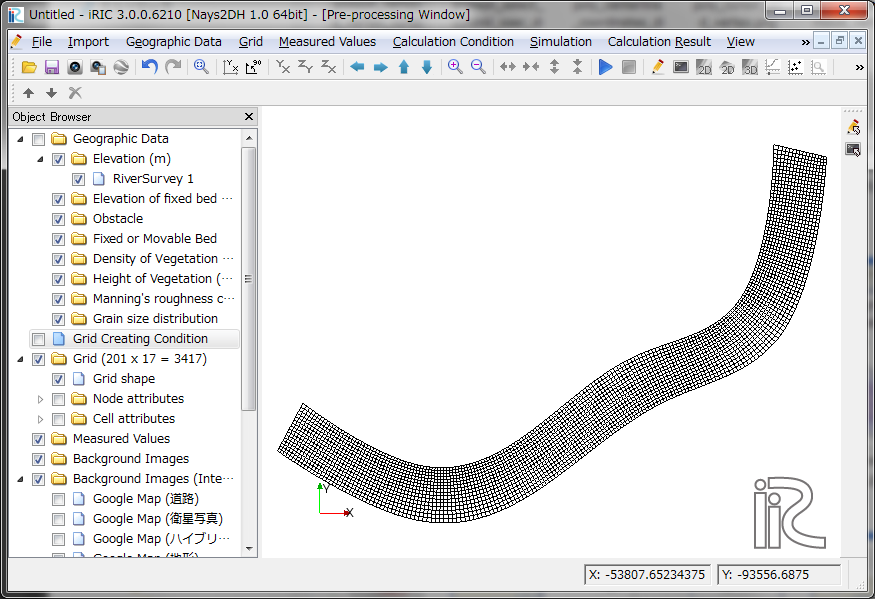
Figure 299 Example of generated grid
Attention
When you specify a small [Max number of iteration] value, Poisson equation will not converge enough.
Attention
When you create grids using this algorithm for strongly curved rivers, it sometimes occurs that grid cells get inverted. When you get grids like this, please try again with different values of nI and nJ, to change rate between them.
Generally speaking, this kind of problem seldom happens when you input nI and nJ value to make dI and dJ values almost the same.
[Build Left bank and Right bank lines]
Description: Generate Left bank and Right bank lines.
Dialog in Figure 296 is shown, so specify the distance values and click on [OK].
Figure 297 shows an example of generated [Left Bank Line] and [Right Bank Line].
You can modify the lines by dragging the vertices.
[Add Vertex] (A)
Description: Add vertices to lines
When you move the mouse cursor to hover on [Center line], [Left Bank Line], or [Right Bank Line] after selecting this menu, The mouse cursor changes to the shape in Figure 300.
Left click on the line and drag it to add a new vertex. The vertex is placed wherever you release the left click button.

Figure 300 The mouse cursor display when adding a vertex is possible
[Remove Vertex] (R)
Description: Deletes the vertex of lines.
When this is selected and you move the cursor onto the vertex of the lines, the cursor shape will change (Figure 301). Left clicking will remove the vertex.

Figure 301 The mouse cursor when removing the vertex is possible
[Edit Center Line Coordinates] (T)
Description: Edits the coordinates of [Center Line].
When you select the menu , the [Center Line Coordinates] dialog (Figure 302) will open. Edit the coordinates and click on [OK].
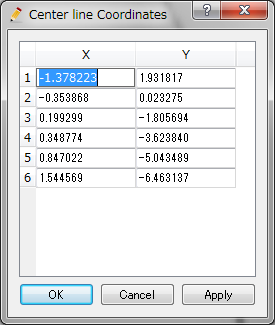
Figure 302 [Center Line Coordinates] dialog
[Edit Left Bank Line Coordinates] (C)
Description: Edits the coordinates of [Left Bank Line].
The procedure is the same to [Edit Center Line Coordinates] (T).
[Edit Right Bank Line Coordinates] (H)
Description: Edits the coordinates of [Right Bank Line].
The procedure is the same to [Edit Center Line Coordinates] (T).
[Reset to Default] (R)
Description: Discards the grid creating conditions and restores the default state.
[Import Center Line] (E)
Description: Import [Center Line] from Shape files or CSV files.
The dialog in Figure 303 is shown, so please select the file you want to import, and click on [Open] button.
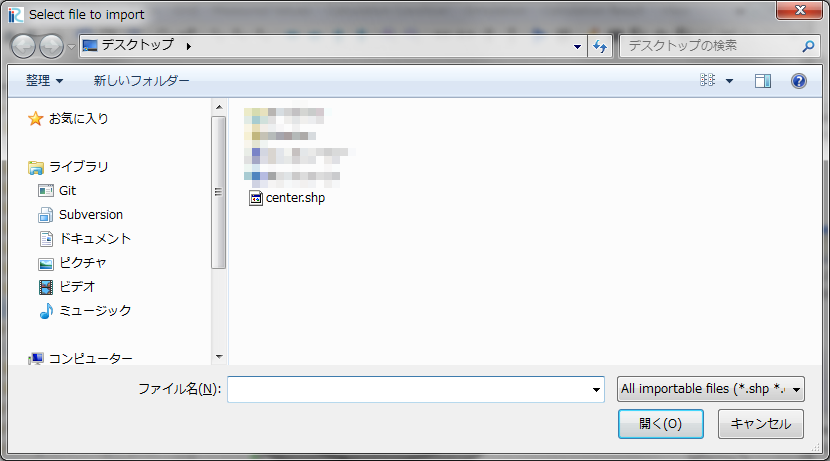
Figure 303 [Select file to import] dialog
[Import Left Bank Line] (L)
Description: Import [Left Bank Line] from Shape files or CSV files.
The procedure is the same to [Import Center Line] (E).
[Import Right Bank Line] (I)
Description: Import [Right Bank Line] from Shape files or CSV files.
The procedure is the same to [Import Center Line] (E).
[Export Center Line] (N)
Description: Export [Center Line] to Shape files or CSV files.
The dialog in Figure 304 is shown, so please specify the name of file you want to export, and click on [Save] button.
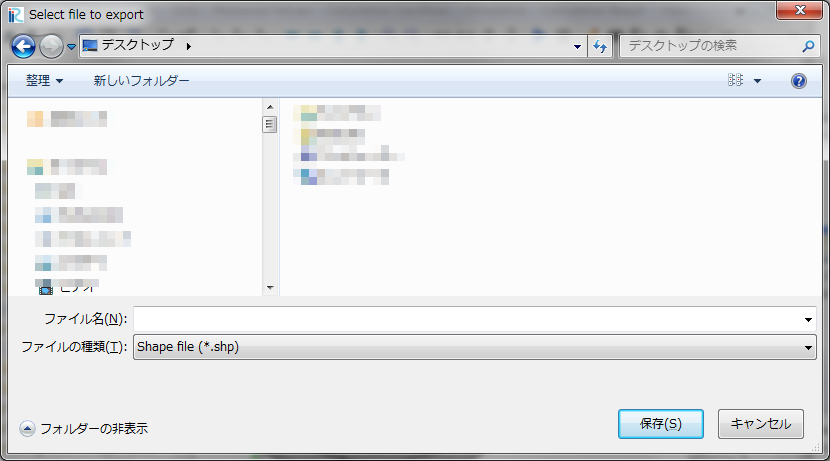
Figure 304 [Select file to export] dialog
[Export Left Bank Line] (F)
Description: Export [Left Bank Line] to Shape files or CSV files.
The procedure is the same to [Export Center Line] (N).
[Export Right Bank Line] (G)
Description: Export [Right Bank Line] to Shape files or CSV files.
The procedure is the same to [Export Center Line] (N).