[Create grid from Cross-Section Data] (2-D structured grid)
Description: Creates a grid from Cross-Section Data. In addition to transverse lines being set, division points are set on the transverse lines, the river centerline and left/right bank lines. Figure 271 shows an example of a grid created by this algorithm.
Before using this algorithm, you need to import Cross-Section Data.
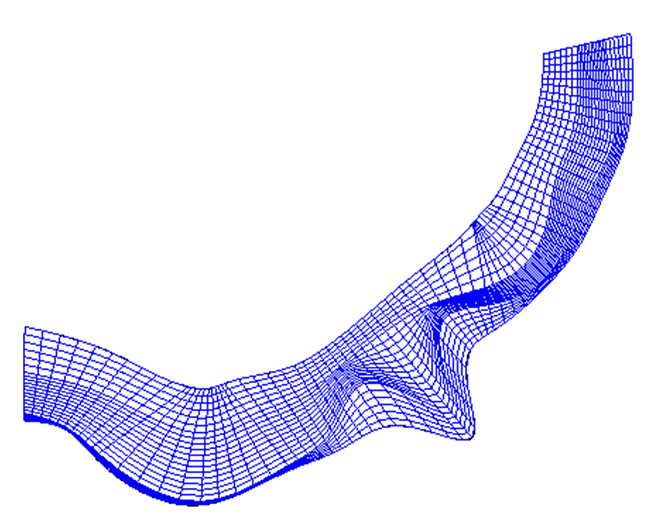
Figure 271 Example of a grid created from Cross-Section Data
The following lines of Cross-Section Data are used as grid lines. In addition, division points added by the user are used to create a grid.
River transverse line
River centerline: the curve made by linking the center point of each river transverse line
Left bank end line: the curve made by linking the left bank end of each river transverse line
Right bank end line: the curve made by linking the right bank end of each river transverse line
Figure 272 shows an example of grid division points and the grid made from these division points.
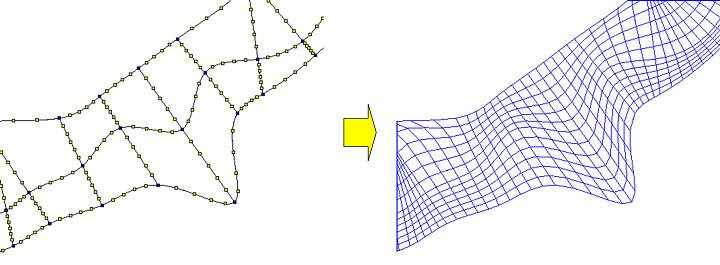
Figure 272 Example of grid division points and the grid made from these division points
Select [Grid Creation] from the menu. The [Grid Creation] dialog (Figure 273) will open. Specify the region where the grid is to be made and click on [OK]. The grid is generated according to the division points. Operations related to the division points are done from the menu shown in Menu items.
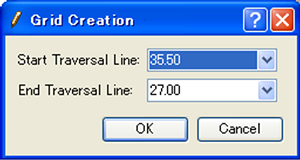
Figure 273 [Grid Creating] dialog
[Add Division Points] (A)
Description: Adds division points to the selected line.
Select the line to which you want to add division points (e.g., river centerline, left bank end line, right bank end line, river transverse line) by clicking on it. Figure 274 shows an example of a display after selecting a line. Then, select [Add Division Points] from the menu. The [Add Division Point] dialog (Figure 275) will open. Input number of divisions and select division method, and click on [OK]. Division points are added to the line (Figure 276).
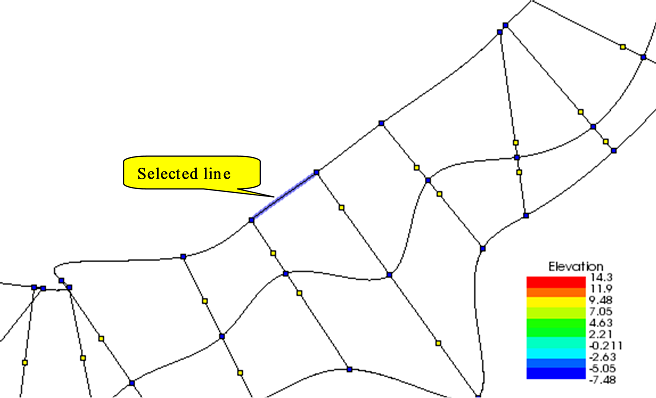
Figure 274 Example of a selected line
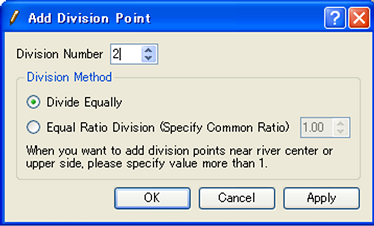
Figure 275 [Add Division Points] dialog
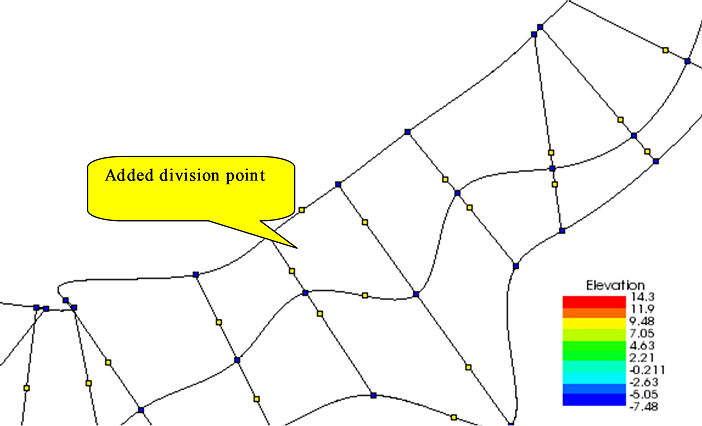
Figure 276 Example of a display after division points have been added
[Add Division Points Regionally] (R)
Description: Simultaneously adds division points to the river centerline and left/right bank lines.
The [Add Division Points Regionally] dialog (Figure 277) will open. Specify the region where division points are to be added and number of divisions, and click on [OK].
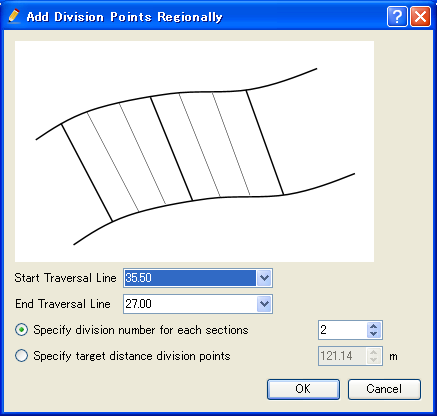
Figure 277 [Add Division Points Regionally] dialog
[Delete Division Points] (D)
Description: Deletes the selected division points.
Figure 278 shows an example.
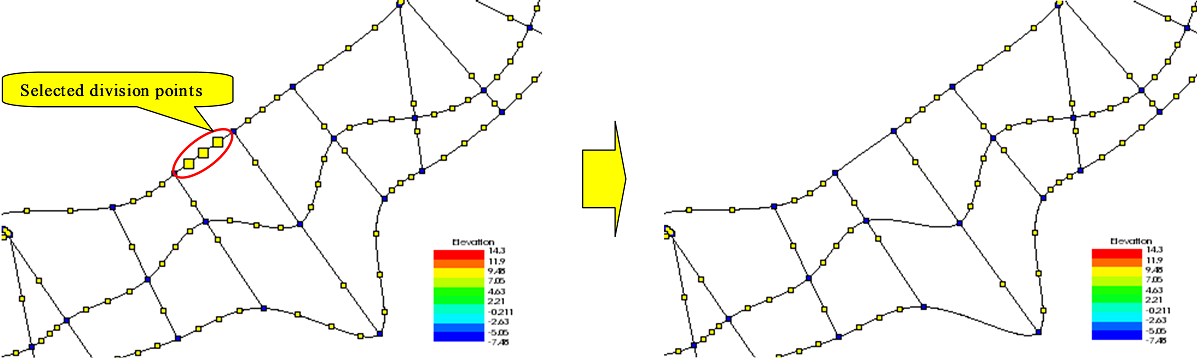
Figure 278 Example of deleting a division point
[Move Division Points] (M)
Description: Moves the selected division points. This is possible when selecting continuous division points on the same line.
When you select [Move Division Points], the [Move Division Points] dialog (Figure 279) will open. Set [Transfer Quantity] and click on [OK].
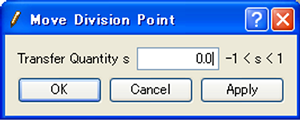
Figure 279 [Move Division Points] dialog
[Reposition Division Points] (P)
Description: Relocates the selected division points. This is possible when selecting continuous division points on the same line.
When this is selected, the [Reposition Division Points] dialog (Figure 280) will open. Edit the coordinates and click on [OK].

Figure 280 [Reposition Division Points] dialog
Reset to default (R)
Description: Discard the modifications of grid creating condition, and restore to the state just after selecting the grid creating algorithm.