Editing [River Survey Data]
[River Survey Data] is a type of Geographic Data] that is based on actual cross-sectional survey data of a river. [River Survey Data] is used as the elevation information for a river and its environs.
Figure 169 shows an example of [River Survey Data].
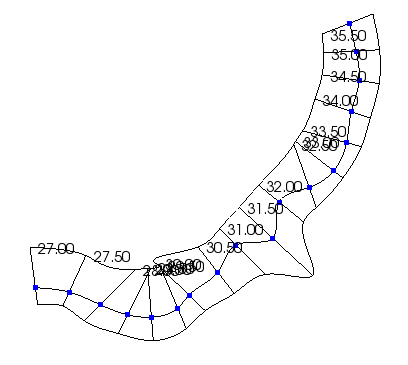
Figure 169 [River Survey Data]
[River Survey Data] has two modes shown in Table 15.
| Mode | Description |
|---|---|
| [Create Mode] | Mode to create a new [River Survey Data] |
| [Edit Mode] | Mode to edit existing [River Survey Data] |
When you select [Add] –> [River Survey Data] in [Object Browser], new [River Survey Data] is created with [Create Mode]. When you import [River Survey Data] using function explained in [Geographic Data] (E), [River Survey Data] is imported and [Edit Mode] is activated.
The sections below explains the functions for each mode.
[Create Mode]
Create [River Survey Data] to region which is defined by [Center line], [Left bank line], and [Right bank line].
After [Create Mode] is started, click on the canvas to specify a few points on the centerline of the [River Survey Data]. To finish, press the Enter key or double click. Figure 170 shows an example of the display when the centerline has been set.
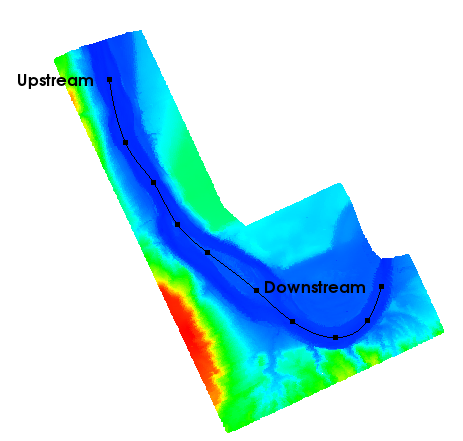
Figure 170 Example of display after the centerline has been set
Next, please generate left bank line and right bank line. Select [Build Left bank and Right bank lines] from menu. [Build Bank Lines] dialog (Figure 171) will be shown. When you input the distance on the dialog and click on [OK], Left bank line and Right bank line are generated, and shown like in Figure 172.
You can edit left bank line and right bank line, by dragging the points or by adding or removing points.
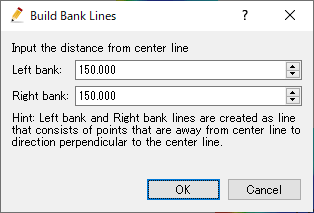
Figure 171 [Build Bank Lines] dialog
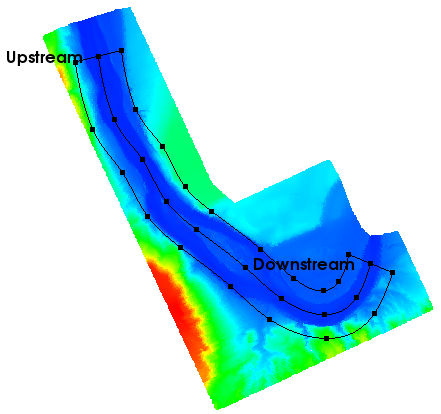
Figure 172 Example of generated Left bank line and Right bank line
At last, select [Create River Survey Data] from menu. [Generate River Survey Data] dialog (Figure 173) will be shown.
When you input the number of cross sections etc. and click on [OK], a new [River Survey Data] is generated.
An example of generated [River Survey Data] is shown in Figure 174.
When [River Survey Data] is generated, mode is switched to [Edit Mode].
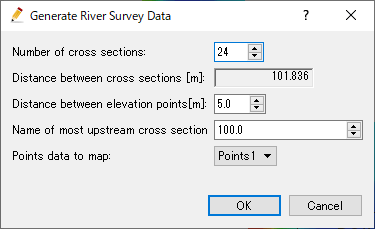
Figure 173 [Generate River Survey Data] dialog
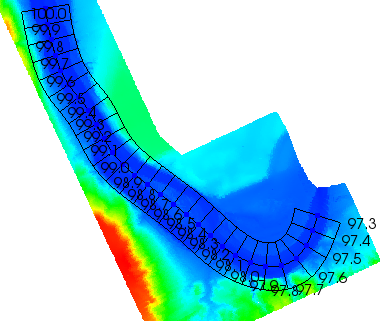
Figure 174 Example of generated [River Survey Data]
[Generate River Survey Data]
Description: Generate [River Survey Data].
[Generate River Survey Data] dialog (Figure 173) will be shown.
When you input the number of cross sections etc. and click on [OK], a new [River Survey Data] is generated.
An example of generated [River Survey Data] is shown in Figure 174.
[Build Left bank and Right bank lines]
Description: Generate Left bank and Right bank lines.
Dialog in Figure 171 is shown, so specify the distance values and click on [OK].
Figure 172 shows an example of generated [Left Bank Line] and [Right Bank Line].
You can modify the lines by dragging the vertices.
[Add Vertex] (A)
Description: Add vertices to lines
When you move the mouse cursor to hover on [Center line], [Left Bank Line], or [Right Bank Line] after selecting this menu, The mouse cursor changes to the shape in Figure 175.
Left click on the line and drag it to add a new vertex. The vertex is placed wherever you release the left click button.

Figure 175 The mouse cursor display when adding a vertex is possible
[Remove Vertex] (R)
Description: Deletes the vertex of lines.
When this is selected and you move the cursor onto the vertex of the lines, the cursor shape will change (Figure 176). Left clicking will remove the vertex.

Figure 176 The mouse cursor when removing the vertex is possible
[Import Center Line] (I)
Description: Import [Center Line] from Shape files or CSV files.
The dialog in Figure 177 is shown, so please select the file you want to import, and click on [Open] button.
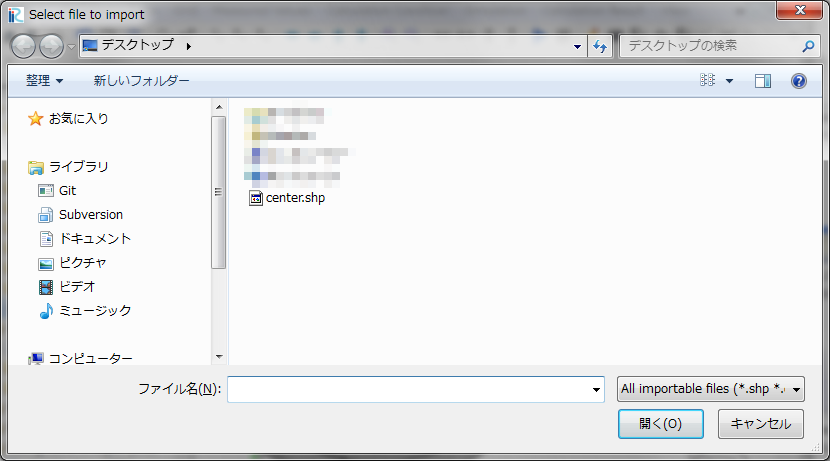
Figure 177 [Select file to import] dialog
[Export Center Line] (E)
Description: Export [Center Line] to Shape files or CSV files.
The dialog in Figure 178 is shown, so please specify the name of file you want to export, and click on [Save] button.
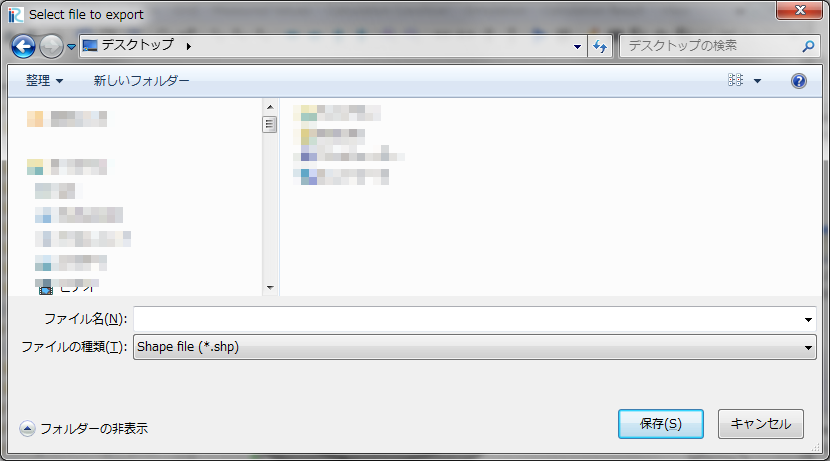
Figure 178 [Select file to export] dialog
[Edit Mode]
Menu items
When the [Pre-processing Window] is active and [River Survey Data] is selected in [Object Browser], you can access menu items related to operations on [River Survey Data] under the following:
Menu bar: [Geographic Data] (E) –> [River Survey Data] (R)
Table 17 shows the menu items under [River Survey Data] (R).
| Menu item | Description |
|---|---|
| [Edit Name] (N) | Edits the name shown in [Object Browser]. |
| [Display Cross-section] (C) | Opens a new river cross-section window. |
| [Insert Upstream Side] (B) | Inserts a new river transverse line on the upstream side. |
| [Insert Downstream Side] (A) | Insert a new river transverse line on the downstream side. |
| [Move] (M) | Moves the river transverse line. |
| [Rotate] (R) | Rotates the river transverse line. |
| [Shift Center] (H) | Shifts the center point of the transverse line. |
| [Extend Horizontally] (X) | Extends or shortens the river traverse line to the left/right. |
| [Delete Cross Section] (T) | Deletes the river transverse line. |
| [Rename Cross Section] (E) | Renames the river transverse line. |
| [Add Extension Line] (L) | Adds a left bank extension line to the river transverse line. |
| [Add Extension Line] (R) | Adds a river bank extension line to the river transverse line. |
| [Remove Left Bank Extension Line] (V) | Removes the left bank extension line from the river transverse line. |
| [Remove Right Bank Extension Line] (O) | Removes the right bank extension line from the river transverse line. |
| [Display Setting] (S) | Displays elevation colormap based on River Survey Data. |
| [Interpolation Mode] | Switch interpolation mode between river transverse lines. |
| [Map points data] | Map points data to river transverse line. |
| [Generate point cloud data] | Generate [Point Cloud Data] using the background grid of the [Cross-Section Data] |
| [Delete] (D) | Deletes River Survey Data. |
Selecting the river transverse line
The river transverse lines need to be selected prior to any operations explained in the following sections, except for displaying elevation colormap. In this section, the operation to select the river transverse line is explained.
To select river transverse lines, left drag on the canvas to make a rectangle (black line) (Figure 179). When you releasing the mouse left button, the river transverse lines whose river center point (blue dot) is in the rectangle (Figure 180) are selected. The selected river transverse lines are drawn with thicker line.
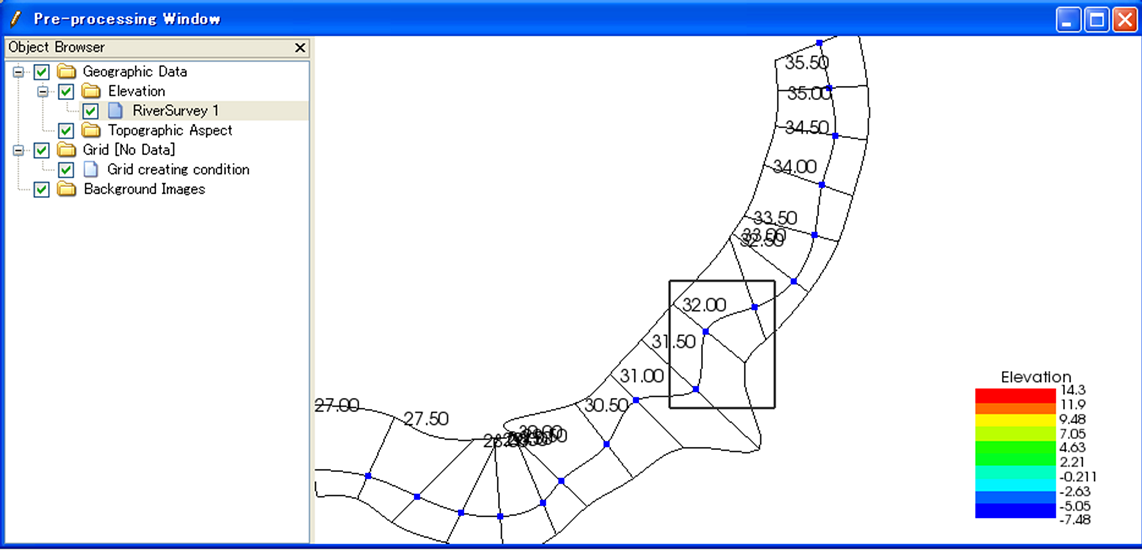
Figure 179 The [Pre-processing Window] when a user is left dragging
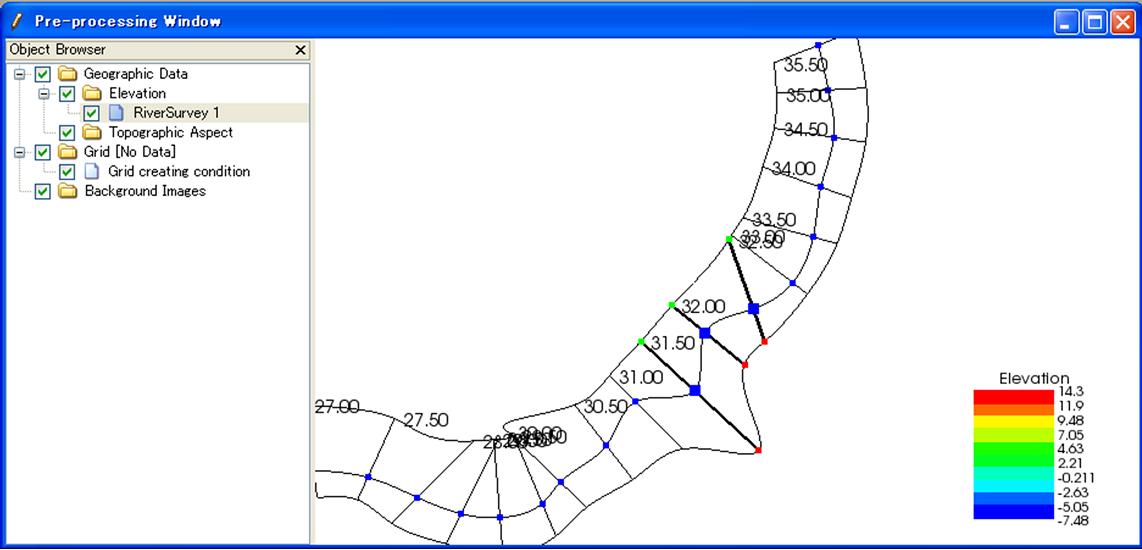
Figure 180 The [Pre-processing Window] after selecting river transverse lines
[Display Cross-section] (C)
Description: Displays the cross-section window.
Prior to this operation, you need to select the river transverse line for which you want to open cross-section window. Figure 181 shows an example of the cross-section window.
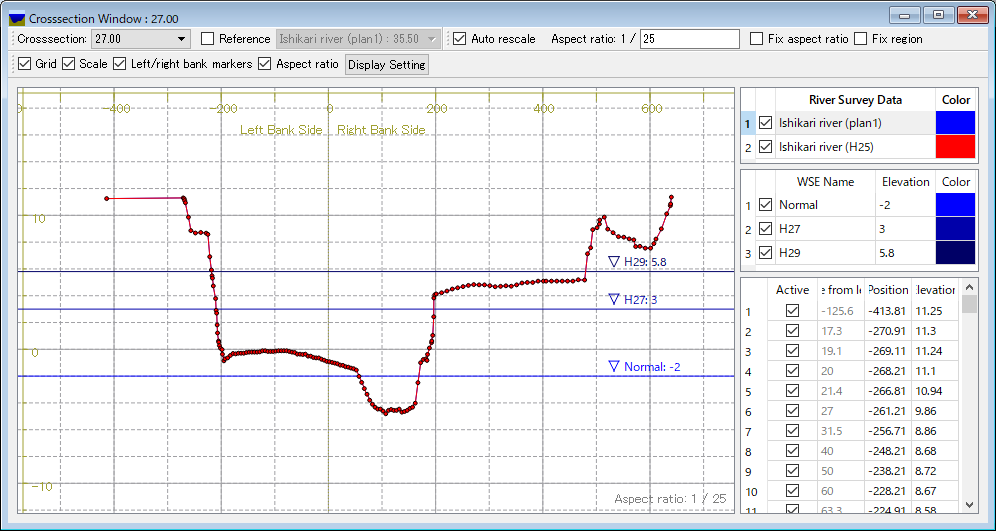
Figure 181 The river cross-section window
For operations in the cross-section window, refer to [Generate point cloud data].
[Insert Upstream Side] (B) / [Insert Downstream Side] (A)
Description: Inserts a new river transverse line upstream (or downstream) from the selected river transverse line.
Prior to this operation, you need to select a river transverse line.
When you select one of these, the [Insert Transverse Line] dialog (Figure 182) will open. Set [River Center Point Coordinates] and [Cross-section Information] and click on [OK].
- [Center Point Coordinates]:
- If you have chosen [Mouse Click], click on the canvas to set the coordinates.
- If you have chosen [Coordinate Values], input the coordinate values in the boxes.
- If you have chosen [Ratio between Back and (0-1)], set the ratio between 0 and 1 to locate the center point on the spline curve. The curve is made by smoothly linking the points before and after the added point.
- [Cross-section Information]:
- If you have chosen [Insert Three Points of Elevation 0], then input the cross-section data of the center, left bank and right bank while securing sufficient distance between each.
- If you have chosen [Copy Next River Transverse Line], copy the cross-section data of the river transverse line specified in the combo box.
- If you have chosen [Create Cross-section of Back and Forth], the cross-section data are made by interpolating the cross-section data of transverse lines immediately upstream/downstream from the transverse line that is to be inserted.
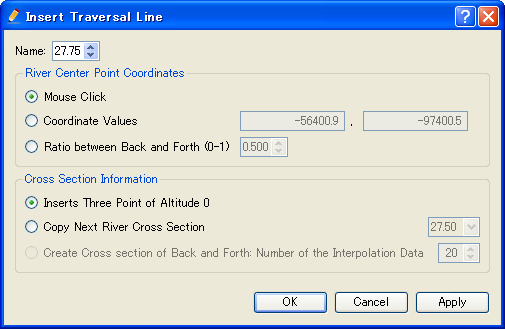
Figure 182 The [Insert Transverse Line] dialog
[Move] (M)
Description: Moves the selected river transverse lines. Figure 183 shows an example.
You can do this operation against multiple transverse lines at a time.
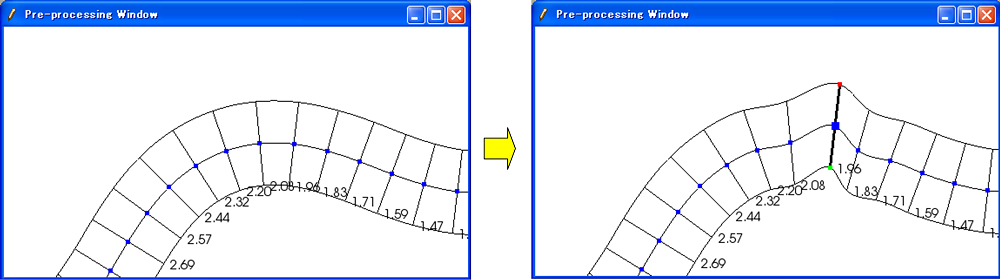
Figure 183 Example of moving a river transverse line
When you select [Move], the [Move Transverse Line] dialog (Figure 184) will open. Select either [Center Point Coordinates] or [Transfer Quantity] and click on [OK].
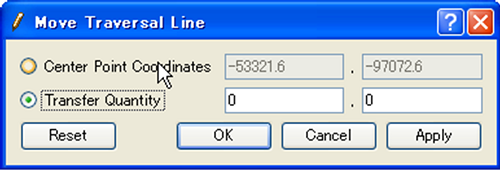
Figure 184 The [Move Transverse Line] dialog
You can also move the river transverse lines with mouse operation. When the mouse cursor is near the center point of the selected river transverse line, the cursor changes to that in Figure 185. Now you can move the selected river transverse lines by left dragging.

Figure 185 Mouse cursor you can move river transverse lines
[Rotate] (R)
Description: Rotates the selected river transverse line. Figure 186 shows an example.
You can do this operation against only one transverse line at a time.
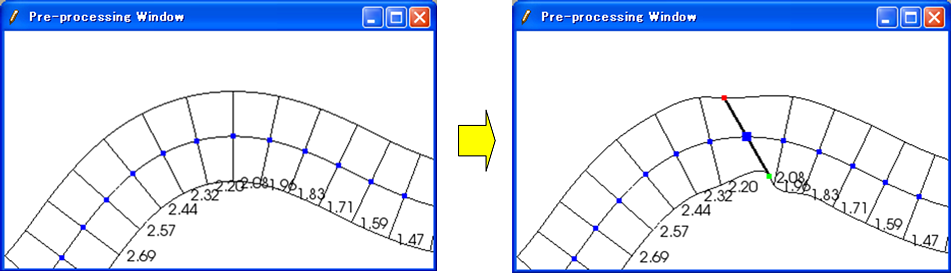
Figure 186 Example of rotating a river transverse line
When you select [Rotate], the [Rotate Transverse Line] (Figure 187) dialog will open. Set either [Relative Angle] or [Increment Angle] and click on [OK]. (Positive direction: counterclockwise; unit: degree)
You can also rotate the river transverse lines with mouse operation. When the mouse cursor is near to the left (or right) bank of the selected river transverse line, the cursor changes to that in Figure 188. Now you can rotate the selected river transverse lines by left dragging.
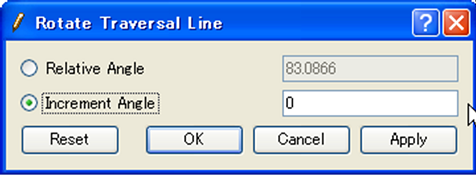
Figure 187 The [Rotate Transverse Line] dialog

Figure 188 Mouse cursor shape when you can rotate a river transverse line
[Shift Center] (H)
Description: Shifts the selected center point of the river transverse line to the left (or right) bank side. By this operation, the location of the center point shifts but the cross-section data do not change. Figure 189 shows an example.
You can do this operation against multiple transverse lines at a time.
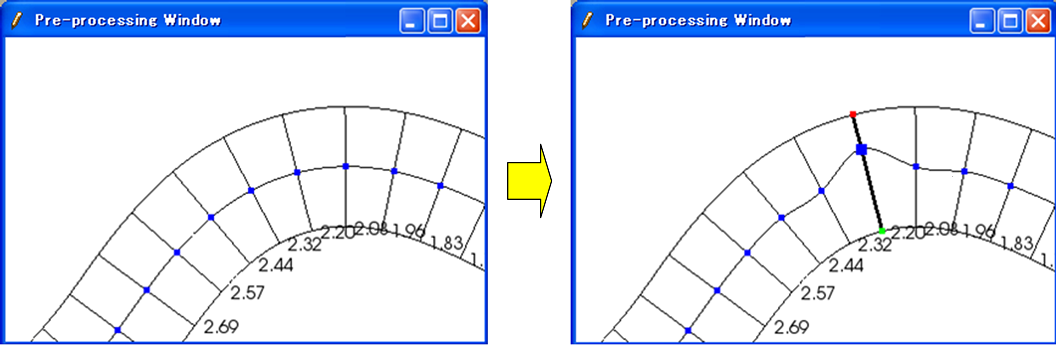
Figure 189 Example of operation to shift the center point
When you select [Shift Center], the [Shift River Center] dialog (Figure 190) will open. Set [Transfer Quantity] and click on [OK].
You can also shift the center point of the river transverse line on canvas with mouse operation. When the mouse cursor is near the center point of the selected river transverse line while the Shift key is held down, the cursor changes to that in Figure 191. Now, you can shift the selected center point of the river transverse line with left dragging.
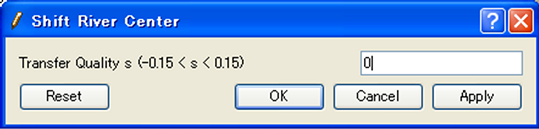
Figure 190 The [Shift River Center] dialog

Figure 191 Mouse cursor shape when you can shift the center point of the river transverse line
[Extend Horizontally] (X)
Description: Extends/Shortens the river transverse lines. Figure 192 shows an example.
You can do this operation against multiple transverse lines at a time.
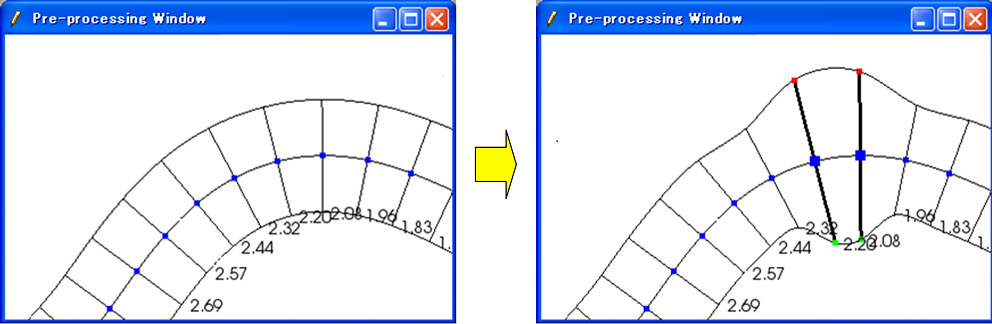
Figure 192 Example of extending the river transverse lines
When you select [Extend Horizontally], the [Extend Transverse Line] dialog will open (Figure 193). Select from among [Set Distance between River Center and Left Bank], [Increment] and [Extension Ratio], set the value and click on [OK].
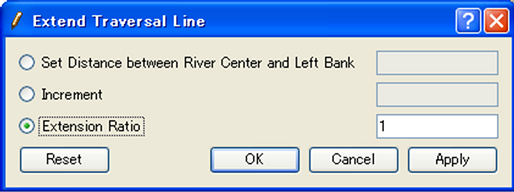
Figure 193 The [Extend Transverse Line] dialog
[Delete Cross Section] (T)
Description: Deletes the selected river transverse lines. Figure 194 shows an example.
You can do this operation against multiple transverse lines at a time.
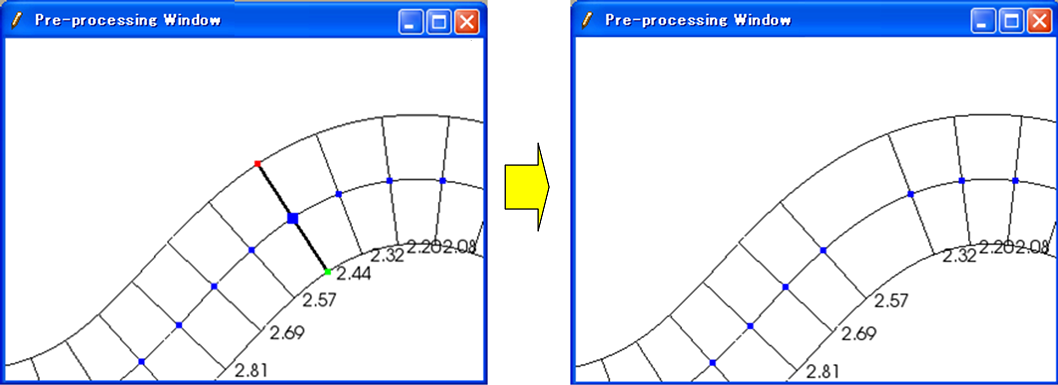
Figure 194 Example of deleting a river transverse line
[Rename Cross Section] (E)
Description: Renames the selected river transverse line.
You can do this operation against only one transverse line at a time.
When you select this, the [Rename Transverse Line] dialog (Figure 195) will open. Set a new name and click on [OK].
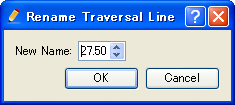
Figure 195 Example of [Rename Transverse Line] dialog
[Add Extension Line] (L) / [Add Extension Line] (R)
Description: Adds a Left Bank Extension Line or Right Bank Extension Line to the selected river transverse line. Figure 196 shows an example.
You can do this operation against only one transverse line at a time.
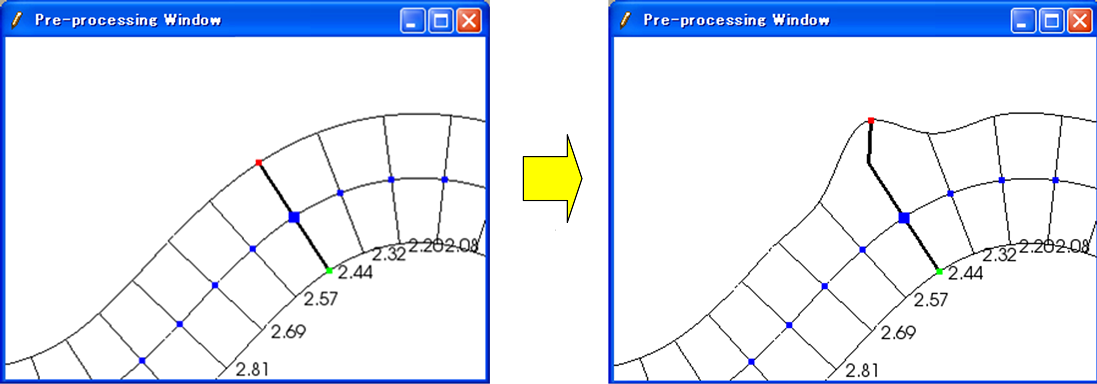
Figure 196 Example of adding a Extension Line to the selected river transverse line
When you select [Add Left Bank Extension Line], the [Add Extension Line] dialog (Figure 197) will open. When you select [Mouse Click], click on the point to which you want to extend the river transverse line, or when you select [Coordinates], input the coordinates of the point to which you want to extend the river transverse line. Then click on [OK].
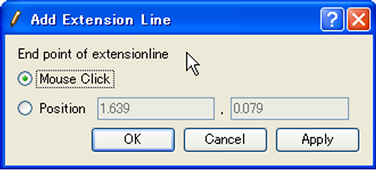
Figure 197 The [Add Extension Line] dialog
[Remove Left Bank Extension Line] (V) / [Remove Right Bank Extension Line] (O)
Description: Deletes a Left Bank Extension Line/Right Bank Extension Line from the selected river transverse line. Figure 198 shows an example.
You can do this operation against only one transverse line at a time. This operation is possible against a river transverse line which has been added the Left Bank Extension Line or Right Bank Extension Line.
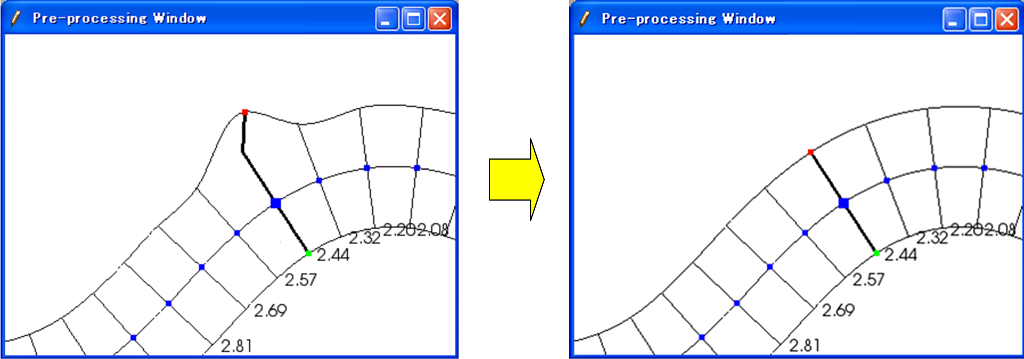
Figure 198 Example of the operation for deleting a Extension Line
[Display Setting]
Description: Edits display setting of [River Survey Data]. Figure 199 shows an example.
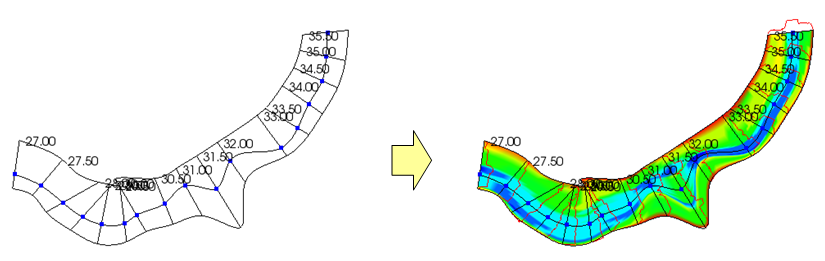
Figure 199 Example of changing [River Survey Data] display setting
When you select [Display Setting], the [Display Setting] dialog (Figure 200) will open. When [Visible] check box inside [Background Color] group box is checked, [River Survey Data] region background is painted. When [Visible] check box inside [Crosssection Lines] group box is checked, the cross-section lines are drawn just below the transverse line, with the Z-scale and color in that group box.
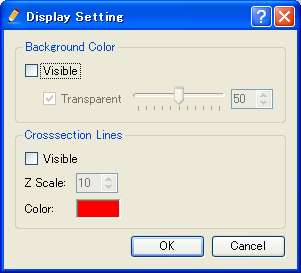
Figure 200 The [Display Setting] dialog
[Interpolation Mode]
Description: Switches the Interpolation Mode (“Spline” or “Linear Curve”).
Figure 201 shows an example of Spline Interpolation Mode. Figure 202 shows an example of Linear Curve Interpolation Mode.
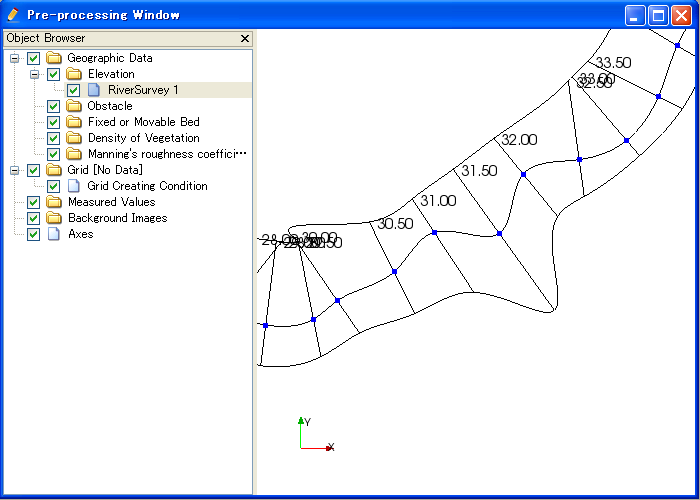
Figure 201 Example of the [Interpolation Mode (Spline)]
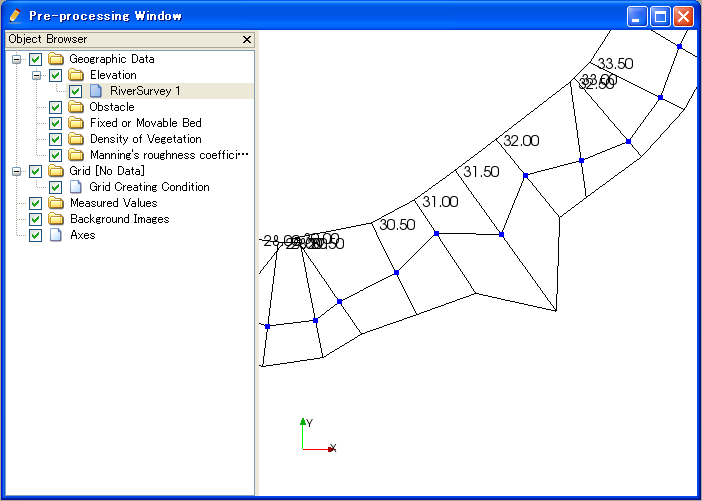
Figure 202 Example of the [Interpolation Mode (Linear Curve)]
[Map points data]
Description: Map points data to the selected river transverse line.
When you select this, the [Map points data] dialog (Figure 203) will open. Input distance between elevation points etc. and click on [OK].
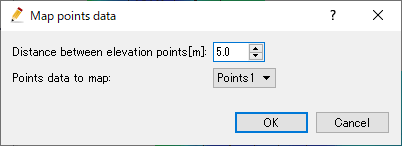
Figure 203 [Map points data] dialog
[Generate point cloud data]
Description: Generate [Point Cloud Data] using the background grid of the [Cross-Section Data].
When you select this a new [Point Cloud Data] is generated, and the dialog in Figure 204 is shown.
Figure 205 shows an example of [Point Cloud Data] generated using this function.
Figure 204 [Information] dialog
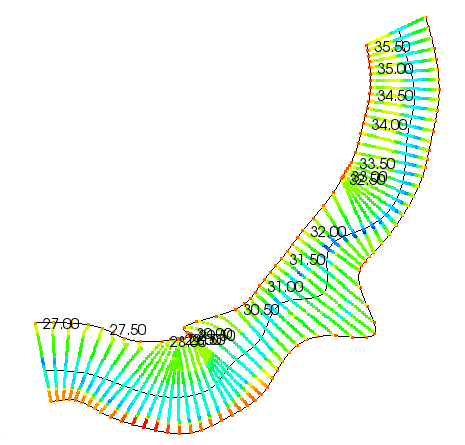
Figure 205 Example of [Point Cloud Data] generated from [Cross-Section Data]
Note
The density of points generated with this function can be changed by editing the setting about [Background Grid]. Please refer to [Background Grid] tab about how to edit setting about [Background Grid].
Note
You can generate [Point Cloud Data] from [Cross-Section Data], by generating a grid from [Cross-Section Data], and then generating [Point Cloud Data] from the attribute of generated grid. Please refer to [Create grid from Cross-Section Data] (2-D structured grid) for detail.
Operation in the River Cross-section Window
Description: Displays the cross-section of a river transverse line. The window is used to edit elevation information. Figure 206 shows an example of the River Cross-section Window.

Figure 206 Example of the River Cross-section Window display
Menu items
Table 18 shows the additional menu items for the River Cross-section Window. The additional menu items are shown between [Import] and [Simulation] when River Cross-section Window is active.
| Menu item | Description | |
|---|---|---|
| Elevation Point (A) | [Activate] (A) | Activates the selected elevation point. |
| [Inactivate] (I) | Inactivates the selected elevation point. | |
| [Inactivate using water elevation] | Inactivate points that are outside of the positions where the elevation exceed water elevation for the first time. | |
| [Edit cross section from the selected point] | Edit cross section shape from the selected point. | |
| [Move] (M) | Moves the selected elevation point. | |
| [Delete] (D) | Deletes the selected elevation point. |
Toolbar functions
Table 19 shows the toolbar items for River Cross-section Window.
| Item | Description |
|---|---|
| Crosssection | Switches the cross-section to show |
| Reference | Shows reference cross-section. You can switch the cross-section to show with combobox. |
| Auto rescale | If it is checked, when user switches the cross-section to show, automatic rescale is executed, so that new cross-section is shown in the center. |
| Aspect ratio | Current aspect ratio is shown. You can also edit the value to change setting. |
| Fix aspect ratio | If it is checked, Ctrl + Middle-drag changes to zoom-in/zoom out without changing aspect ratio. |
| Fix retion | If it is checked, Ctrl + Middle-drag and Ctrl + Left-drag operations are disabled. |
| Grid | You can switch on/off background grid |
| Scale | You can switch on/off scales shown at left edge and top edge. |
| Left/right bank markers | You can switch on/off “Left Bank Side”, “Right Bank Side” markers shown at top edge. |
| Aspect ratio | You can switch on/off Aspect ratio shown at right bottom. |
| Display Setting | Shows Display Setting dialog (see Figure 207). |
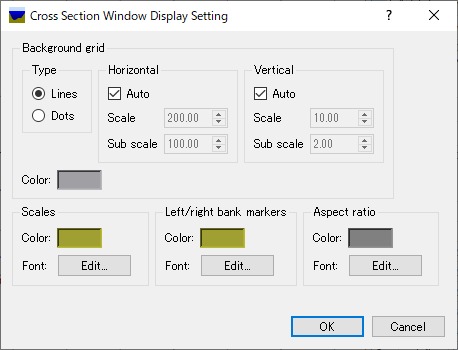
Figure 207 Cross-section Window Display Setting dialog
[Activate] (A)
Description: Activates the selected elevation point. Figure 208 shows an example.
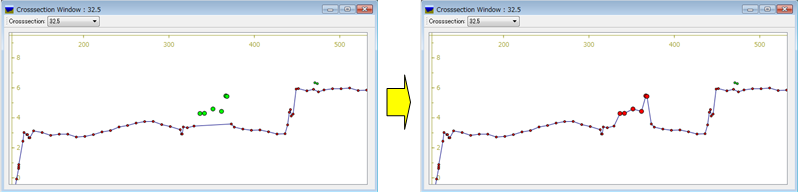
Figure 208 Example of activating elevation point
[Inactivate] (I)
Description: Inactivates the selected elevation point. Figure 209 shows an example.
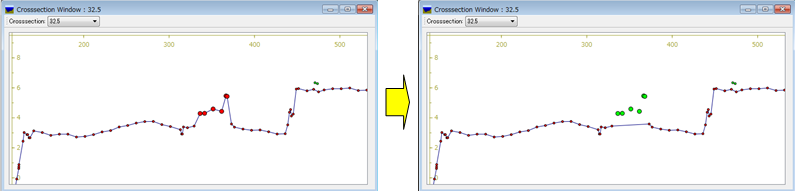
Figure 209 Example of the inactivating an elevation point
[Inactivate using water elevation]
Description: Inactivate points that are outside of the positions where the elevation exceed water elevation for the first time.
When multiple water elevation data is loaded, a dialog to select the water elevation is shown.
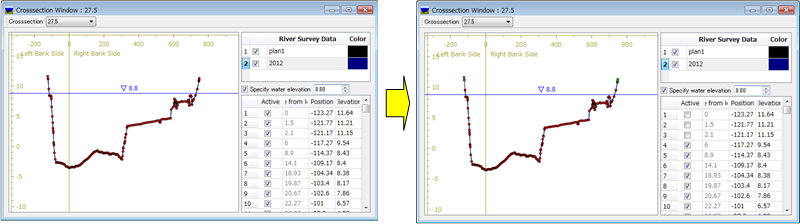
Figure 210 Example of the operation for inactivate using water elevation
[Edit cross section from the selected point]
Edit the cross section shape from the selected point.
When you want to use this function, please select only one point on the cross section first.
After activating this function, when you move the mouse cursor, The line to preview the geometry shape after editing will be shown like in Figure 211. While editing, the horizontal and vertical length of the line, and the gradient will be shown for the line that is going to be created.
You can define the end point of the line by moving the mouse cursor, and execute the editing operation by left clicking.
You can finish editing operation by double clicking, or pressing Enter key.
The gradient values used in this function is selected from the values defined on [River Survey Data] tab.
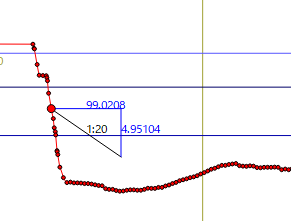
Figure 211 Example of cross section editing operation by mouse
When you right click on the canvas while activating this function, [Edit from Dialog] menu will be shown. When you select this menu, the dialog in Figure 212 will be shown.
On this dialog, you can edit the cross section shape by inputting the distance and gradient etc.
By pressing [Apply] button, you can preview the cross section shape after editing.
By pressing [Edit Next] button, you can execute the editing operation, select the new point added by the operation, and continue editing. This function is useful when you want to edit the cross section shape continuously.
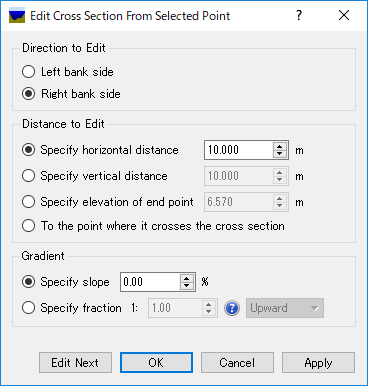
Figure 212 Example of [Edit Cross Section From Selected Point] dialog
Using this function, you can easily create cross section shapes that is composed of line. Figure 213 shows an example.
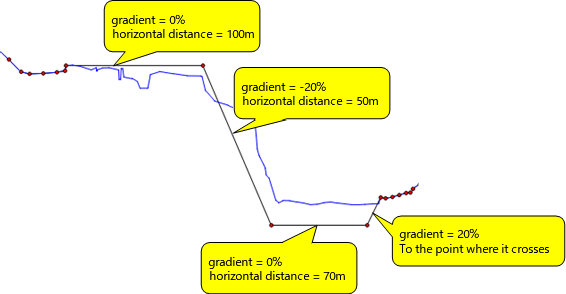
Figure 213 Example of editing operation of cross section
[Move] (M)
Description: Moves the selected elevation point. Figure 214 shows an example.
When you select [Move], the [Move Elevation Point] dialog (Figure 215) will open. Set horizontal/vertical offset and click on [OK].
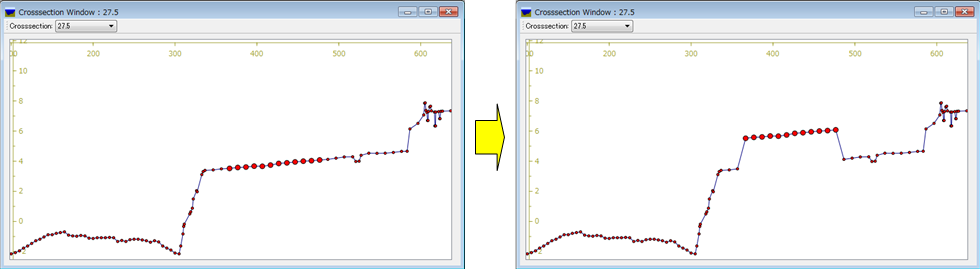
Figure 214 Example of the operation for moving an elevation point
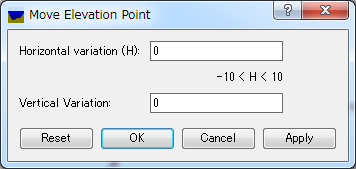
Figure 215 The [Move Elevation Point] dialog
You can also move the elevation point on the canvas with a mouse operation. When the mouse cursor is near the selected elevation point, the cursor changes to an “open hand” cursor. Now you can move the selected elevation point by left dragging.
[Delete] (D)
Description: Deletes the selected elevation point. Figure 216 shows an example.
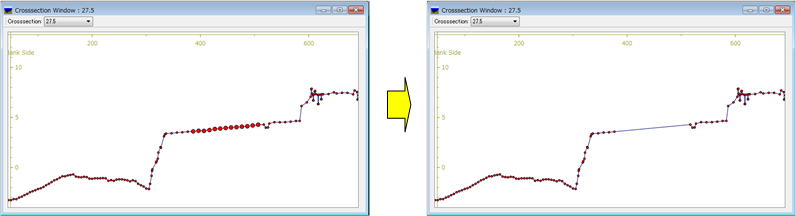
Figure 216 Example of deleting an elevation point