Editing [Point Cloud Data]
[Point Cloud Data] consist of coordinates and attribute at that point. Figure 144 shows an example of the [Point Cloud Data].
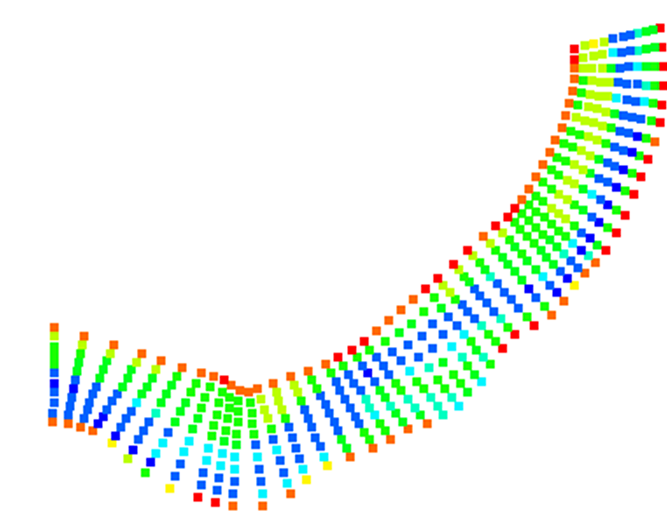
Figure 144 The [Point Cloud Data]
[Select Points With Polygon] (P)
Description: Defines a polygon region, and select points within that polygon.
Click on canvas region to specify polygon vertices positions sequentially. By double-clicking or pressing Enter key, the polygon is defined and the points within that polygon are selected. Figure 145 shows an example of the [Pre-processing Window] while defining a polygon region. Figure 146 shows an example of the [Pre-processing Window] after selecting.
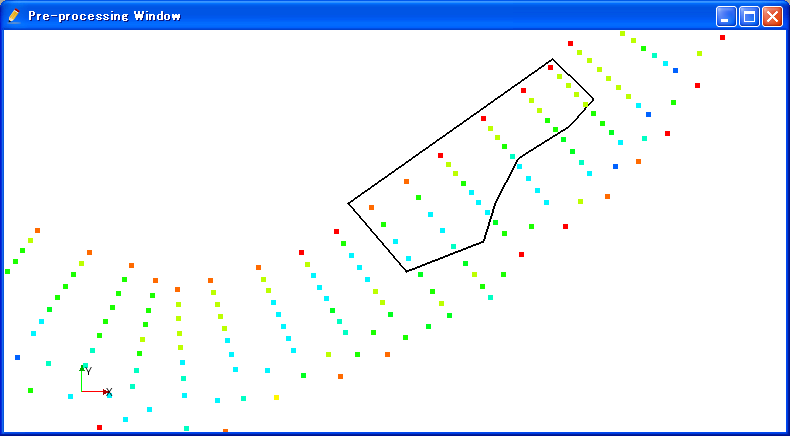
Figure 145 The [Pre-processing Window] while defining a polygon region
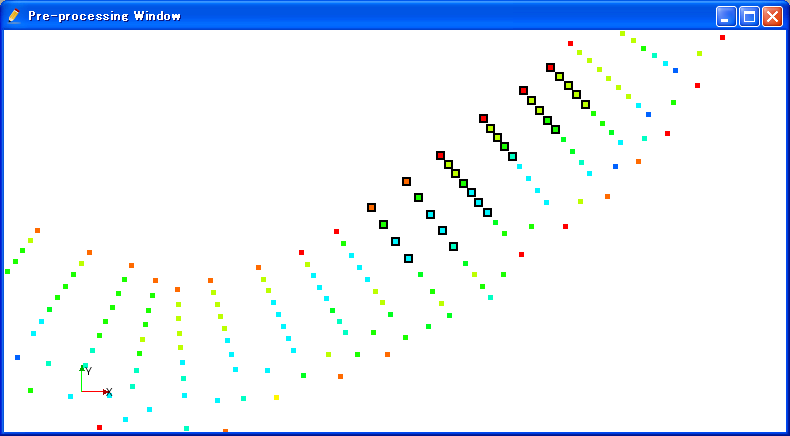
Figure 146 The [Pre-processing Window] after selecting points within the polygon region
In normal status, points can be selected with left-dragging.
[Edit Selected Points] (E)
Description: Edits the selected points.
When you select [Edit Selected Points], the [Edit Points] dialog (Figure 147) will open. Input new Value at the selected points, and click on [OK].
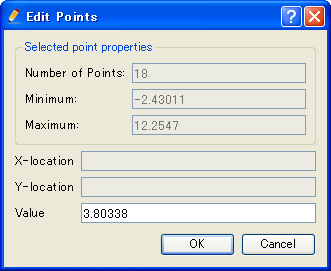
Figure 147 The [Edit Points] dialog
[Export Selected Points] (X)
Description: Exports the selected points to an external file.
When you select [Export Selected Points], the [Select file to export] dialog (Figure 148) will open. Input the file name to export and click on [Save].
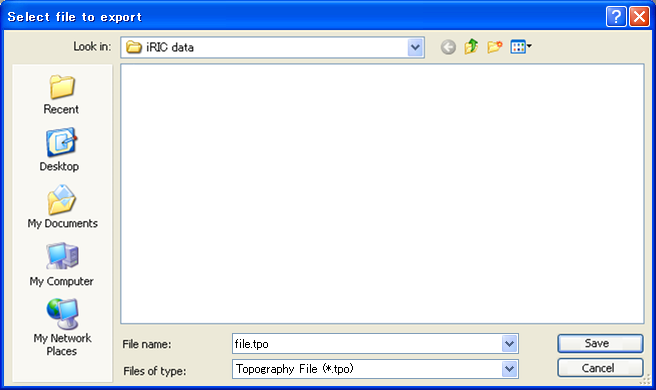
Figure 148 The [Select file to export] dialog
[Add New Point] (A)
Description: Adds new points.
When you select [Add New Point], select a point that already exists first. The value at that point will be the default value at the points you are going to add. Then, click on the canvas where you want to add new points. Finish by double-clicking or by pressing Enter key. The [Add Points] dialog (Figure 149) will open, so input the Value at new points and click on [OK].
Figure 150 shows an example of [Pre-processing Window] while adding new point.
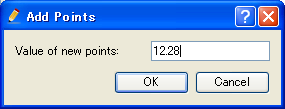
Figure 149 The [Add Points] dialog
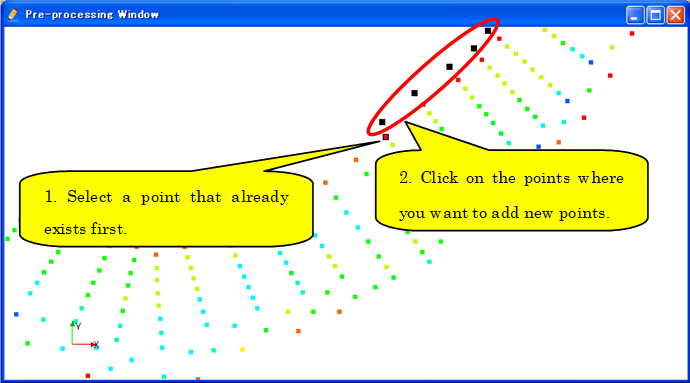
Figure 150 Example of adding new points
[Interpolate Points] (I)
Description: Adds new points between points that already exists.
After you select [Interpolate Points], click on multiple points that already exists, between which you want to interpolate points. Finish by double-clicking or pressing Enter key. The [Dialog] (Figure 151) will open, so edit the setting and click on [OK] to interpolate points.
Figure 152 shows an operation of interpolating points.
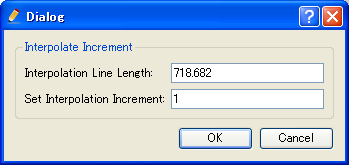
Figure 151 The [Dialog]
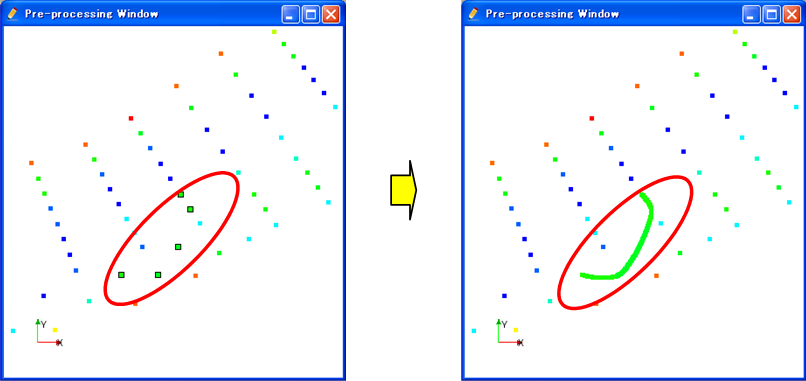
Figure 152 Example of interpolating points
[Delete Selected Points] (O)
Description: Deletes the selected points. Figure 153 shows an example.
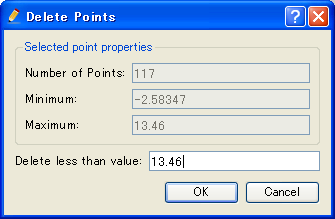
Figure 153 Example of deleting selected points.
[Delete Selected Points Less Than Value] (L)
Description: Deletes the points that are selected, and have value less than that you specify.
When you select [Delete Selected Points Less Than Value], the [Delete Points] dialog (Figure 154) will open. Input the value and click on [OK]. Figure 155 shows an example.

Figure 154 The [Delete Points] dialog
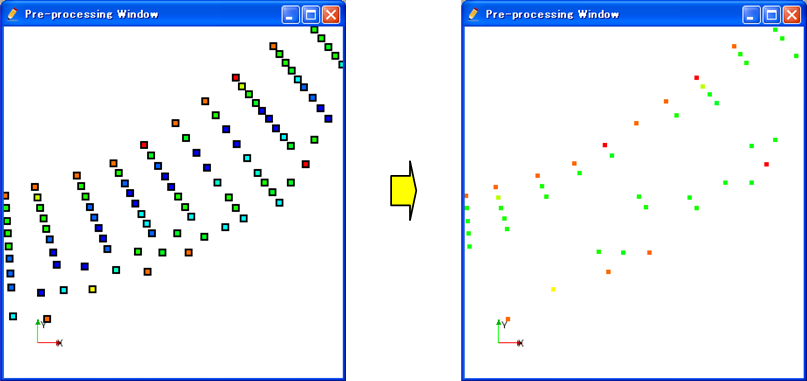
Figure 155 Example of deleting selected points less than the specified value.
[Delete Selected Points Greater Than Value] (G)
Description: Deletes the points that are selected, and have value greater than that you specify.
When you select [Delete Selected Points Greater Than Value], the [Delete Points] dialog (Figure 156) will open. Input the value and click on [OK]. Figure 157 shows an example.
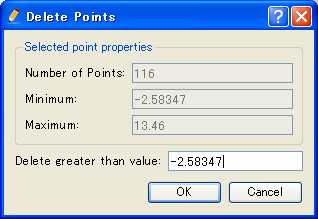
Figure 156 The [Delete points] dialog
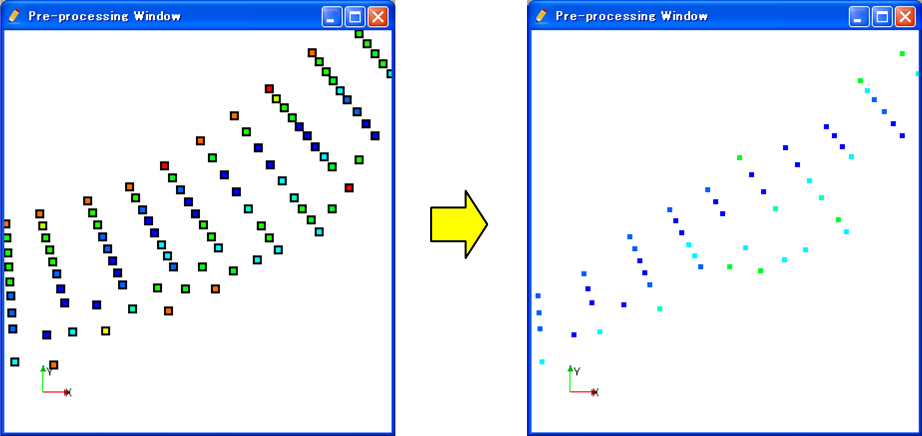
Figure 157 Example of deleting selected points greater than the specified value.
[Add Break Line] (B)
Description: Adds break line.
After you select [Add Break Line], click on the points sequently between which you want to add break line. Finish by double-clicking of pressing Enter key.
When you [Remesh TINs], break lines will be used as TIN boundary lines. Figure 158 shows an example.
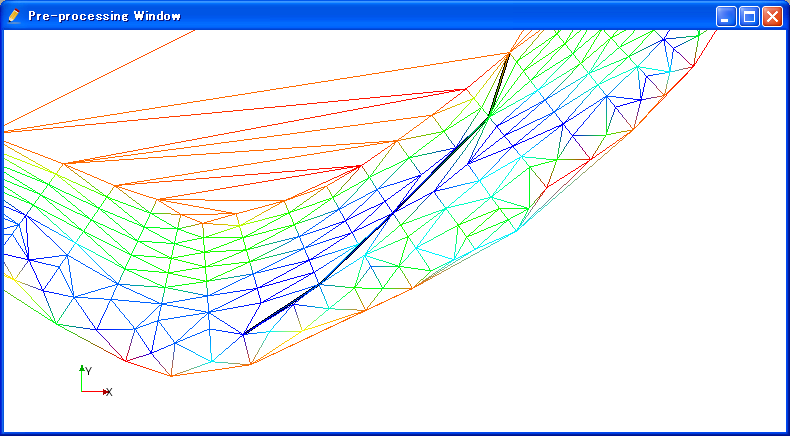
Figure 158 Example of TIN boundarys after adding break line
[Remove Break Line] (R)
Description: Removes break line.
After you select [Remove Break Line], click on the break line you want to remove. The [Warning] dialog (Figure 159) will open, so click on [Yes] to remove the break line.
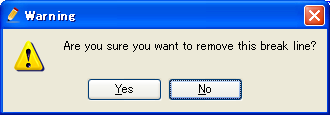
Figure 159 The [Warning] dialog
[Remove All Break Lines] (O)
Description: Removes all break lines.
When you select [Remove All Break Lines], the [Warning] dialog (Figure 160) will open. Click on [Yes].
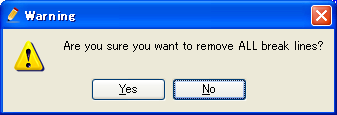
Figure 160 The [Warning] dialog
[Remesh TINs] (T)
Description: Remesh TINs that are used for interpolation.
Remeshing TINs will be necessary when points are added or removed, and/or break lines are added or removed. Figure 161 shows an example of remeshing TINs.

Figure 161 Example of remeshing TINs
[Remove triangles with long edge] (W)
Description: Remove triangles with long edge from TIN.
When TIN is generated, triangles with long edge are sometimes generated in area in which there is not points. Using this function, you can remove such needless triangles.
When you select [Remove triangles with long edge], dialog (Figure 162) will open. Specify the Limit edge length, and click on [Apply].
You’ll see that the triangles with edges longer than limit edge length are shown as gray area. If you need to, you can change limit edge length, and click on [Apply] again. If it seems OK, click on [OK] button to finish the operation.
Figure 163 shows an example of [Point Cloud Data] before removing triangles, Figure 164 shows an example of [Point Cloud Data] after clicking [Apply] button, and Figure 164 shows an example of [Point Cloud Data] after removing triangles, for each.
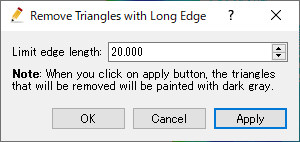
Figure 162 [Remove triangles with long edge] dialog
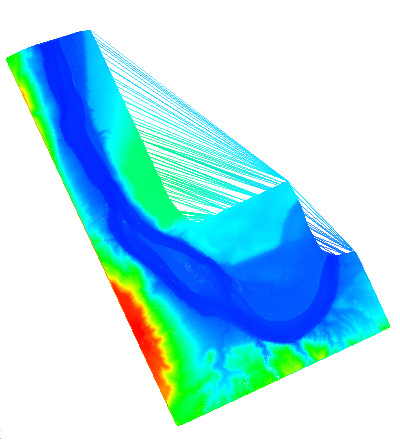
Figure 163 [Point Cloud Data] before removing triangles
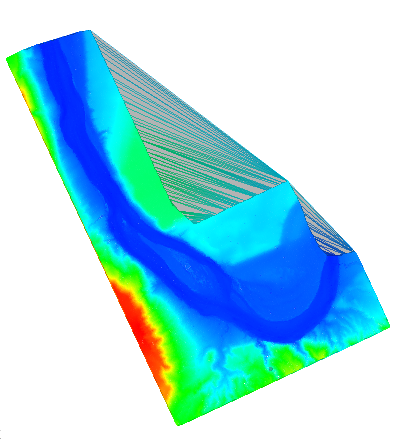
Figure 164 [Point Cloud Data] display example after clicking [Apply] button
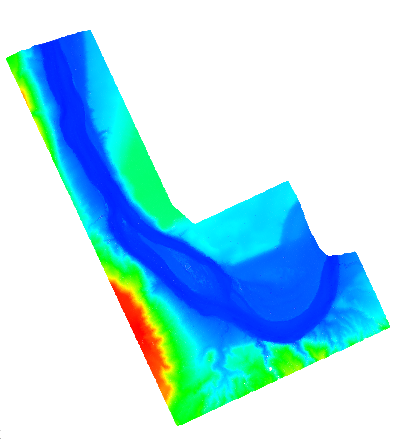
Figure 165 [Point Cloud Data] after removing triangles
[Merge]
Description: Merge points in other [Point Cloud Data] to this data.
When you select [Merge], the [Select data to merge] dialog (Figure 166) will open. Select the data to merge, and click on [OK] button. Them, the [Point Cloud Data] is merged, and the [Remesh TINs] is executed.
When you’ve imported [Point Cloud Data] for neighbor regions as separate data, it happens that when the [Point Cloud Data] is mapped to grid attributes, values are not mapped correctly to nodes (or cells) in the boundary region of those data. In such cases, executing mapping after merging the data will solve the problem.
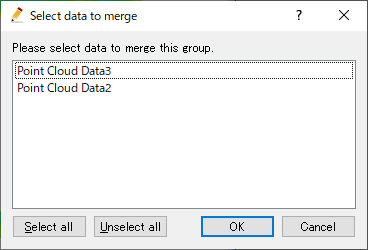
Figure 166 [Select data to merge] dialog
[Display Setting] (S)
Description: Changes display setting of [Point Cloud Data].
[Point Cloud Data] can be visualized in the three methods: [Points], [Wireframe], and [Surface]. Figure 167 shows the three methods.
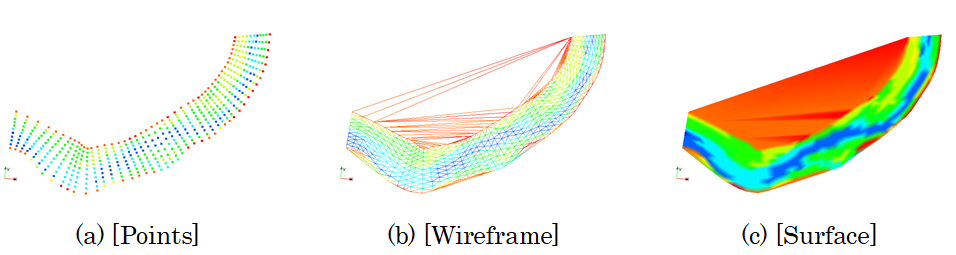
Figure 167 [Point Cloud Data] display methods
When you select [Display Setting], the [Display Setting] dialog (Figure 168) will open. Change settings and click on [OK]. [Transparent] is active only when you select [Surface] for [Display Method].
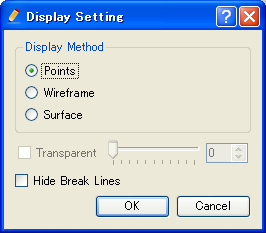
Figure 168 The [Display Setting] dialog