[Geographic Data (from web)]
Description: Imports geographic data from web services
When you select this, the dialog to select the type of data to import (the [Select Data Type] dialog, refer to Figure 87) is shown.

Figure 87 The dialog to select the type of data
Currently the following two types of data can be imported:
Point cloud data generated from elevation CSV tiles
Cross-section data of Hokkaido Regional Development Bureau
Each of them is explained below.
Point cloud data generated from elevation CSV tiles
Please follow the steps below, to import the data.
In the dialog to select the type of data, select [Point cloud data from Elevation CSV tile].
If you’ve not specified the coordinate system for the project, the [Select Coordinate System] dialog (Figure 62) is shown. Please select coordinate system and click on [OK] button.
[Select Region] dialog (Figure 88) is shown. Use the following operations to select the region, and click on [Next]:
Ctrl + Left-dragging to Pan the map.
Ctrl + Middle-dragging to Zoom in/out the map. You also can use [Zoom In] and [Zoom Out] buttons.
Left-dragging to select region. The selected region is shown as a box with black line.
Click on [Next] button, and the [Zoom Level Setting] dialog is shown. In this dialog, you can change the setting like below:
You can select [Zoom level]. If you change the setting, you can review the abstract resolution and the size of data you are going to download, with [Resolution] and [Data size]. The default value of the [Zoom level] is the maximum value, so that user usually use the data with the highest resolution.
You can select [Source]. By default, you can select the elevation tiles distributed by the Geospatial Information Authority of Japan (GSI) (DEM5A, DEM5B, DEM10B). When you want to use other sources, add them in the [Web Elevation Data] tab of the [Preferences] dialog.
Note
SRTM data distributed by USGS, which was included in the default sources in previous versions, has been removed from the default sources because it is no longer distributed.
Click on [OK], iRIC starts downloading, dialog in Figure 90 is shown.
When the downloading finishes, the dialog disappears, and the downloaded geographic data is shown like Figure 91.
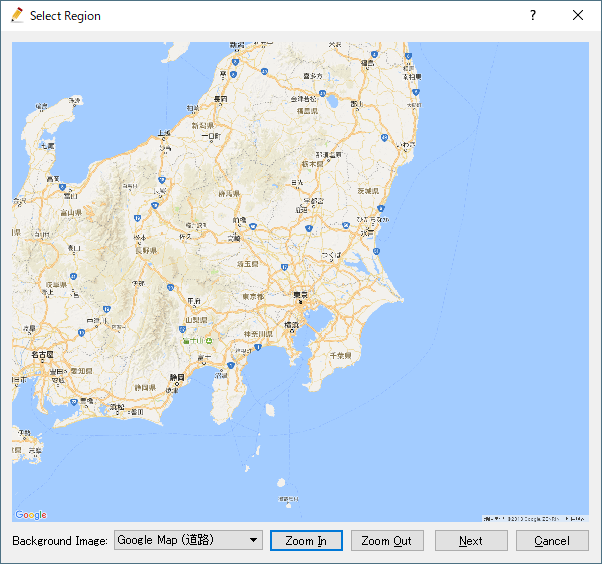
Figure 88 The [Select Region] dialog
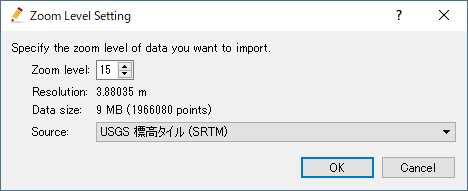
Figure 89 The [Zoom Level Setting] dialog
Figure 90 The [Please wait] dialog
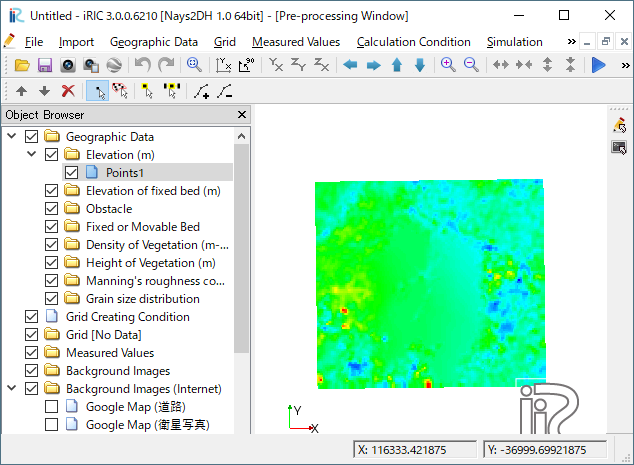
Figure 91 Example of imported geographic data
Cross-section data of Hokkaido Regional Development Bureau
The [Cross-section Data Import Setting] dialog (refer to Figure 92) is shown. Specify the items and click on [OK]. The items are as follows.
- River
Select the river to import.
- Range
Specify the KPs of the downstream end and the upstream end of the range to import in [Downstream] and [Upstream].
- Year
When survey results of multiple years exist, specify the year of the data to import.
The following operations are the same as importing a cross-section data file. Refer to Cross-section data (*.riv) for details.

Figure 92 The [Cross-section Data Import Setting] dialog