[Graph Window]
Figure 17 shows an example of the [Graph Window].
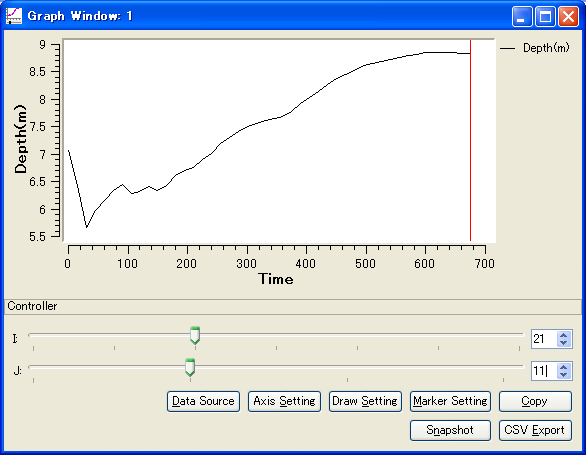
Figure 17 [Graph Window]
The [Graph Window] makes a graph of simulation results whose X-axis is eigher of position (I, J or K) or time. You can change the target data to make graph easily using the slide bars shown below the graph.
You can open a new [Graph Window] with either of the following actions:
Menu bar: [Calculation Results] (R) –> [Open New Graph Window]
Operation Toolbar: ![]()
You can activate a [Graph Window] that already exists, with the following action:
Menu bar: [View] (V) –> The title of window you want to activate; for example “Graph Window: 1”
Refer to [Graph Window] for detail.