Bird’s-Eye View 2D Visualization Functions
The functions for visualizing the 2D calculation results in Bird’s-eye view are explained.
Use [Bird’s Eye 2D Post-processing Window] for bird’s eye view 2D visualization of simulation result as explained below.
[Open new 2D Bird’s Eye Post-processing Window]
Either of the following actions opens a new [Bird’s-Eye Post-Processing Window].
Menu bar: [Calculation Results] (R) –> [Open New Bird’s Eye 2D Post-processing Window]
Operation Toolbar: ![]()
When you select [Open new 2D Bird’s Eye Post-processing Window], the new [Bird’s-Eye 2D Post-processing Window] (Figure 421) will open.
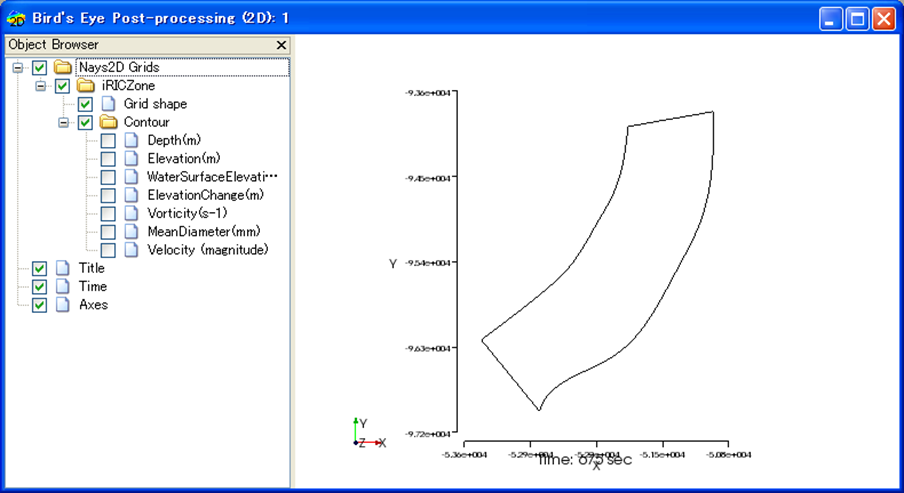
Figure 421 [Bird’s Eye 2D Post-processing Window]
[Object Browser]
An example of the [Object Browser] of [Bird’s-Eye 2D Post-processing Window] is shown in Figure 422.
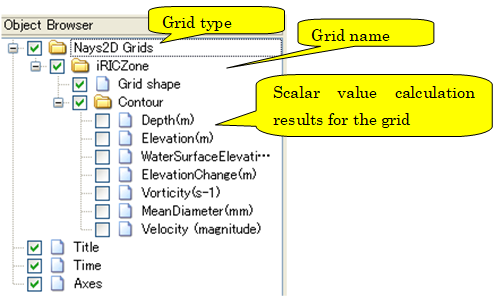
Figure 422 [Object Browser] of the [Bird’s-Eye 2D Post-processing Window]
Settings on the elements shown in the [Object Browser] of [Bird’s Eye 2D Post-processing Window] can be edited mainly from [Draw] menu. For operations on [Axes], refer to [Axes].
[Grid Shape] (G)
Description: Sets the grid shape settings.
When you select [Grid Shape], the [Grid Shape Setting] dialog (Figure 423) will open. Set it and click on [OK]. Figure 424 shows examples of the display when the setting is for [Outline] and [All] respectively.
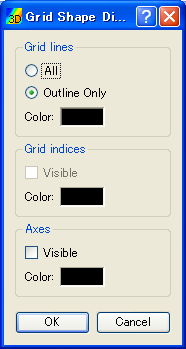
Figure 423 [Grid Shape] dialog
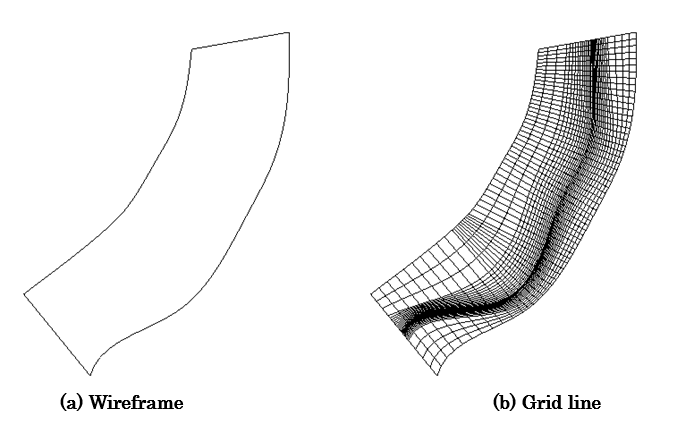
Figure 424 Examples of graphics displayed by the [Grid Shape] setting
[Contours (node)] (C)
Description: Sets the contour settings for calculation results defined at grid nodes.
When you select [Contour], the [Contour Setting] dialog (Figure 425) will open. Set it and click on [OK].
When you click on [Region Setting] button, [Region Setting] dialog (Figure 426 or Figure 427) will open.
When you click on [Color Bar Setting] button, [Color Legend Setting] dialog (Figure 428) will open.
Please refer to [Color Setting] about the dialog that is shown when you select [Custom] as [Colormap] and click on [Setting] button.
Figure 429 shows an example of displayed contours for each [Display Setting] setting.
With iRIC 4.0, it is now possible to visualize contours for multiple calculation results at the same time. For example, you can visualize bed elevation and water surface elevation at the same time.
To show multiple contours, select “Scalar (node)” and select “Add” from right-clicking menu.
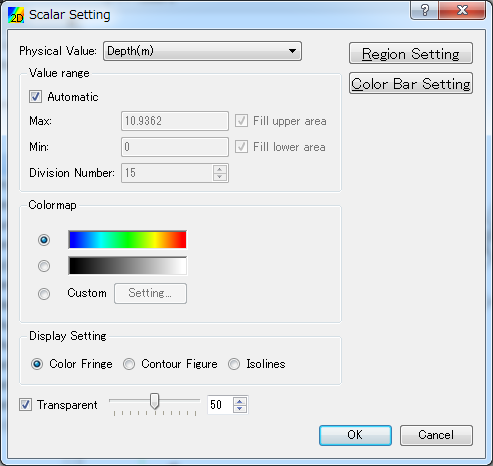
Figure 425 [Contour Setting] dialog
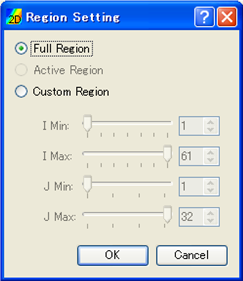
Figure 426 [Region Setting] dialog (Structured grid)
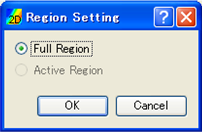
Figure 427 [Region Setting] dialog (Unstructured grid)
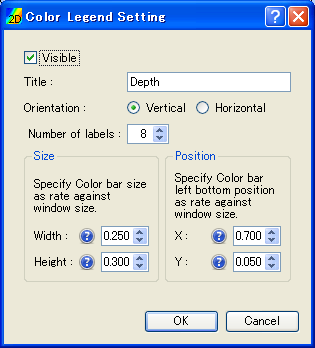
Figure 428 [Color Legend Setting] dialog
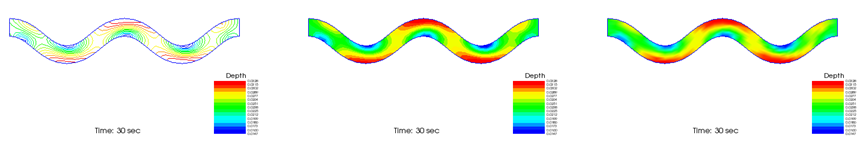
Figure 429 Examples of the contour display by the [Display Setting] setting
[Contour (Cell center)] (L)
Description: Sets the contour settings for calculation Results defined at cell centers.
When you select [Contour], the [Contour Setting] dialog (Figure 430) will open. Set it and click on [OK].
When you click on [Region Setting] button, [Region Setting] dialog (Figure 431 or Figure 432) will open.
When you click on [Color Bar Setting] button, [Color Legend Setting] dialog (Figure 433) will open.
Please refer to [Color Setting] about the dialog that is shown when you select [Custom] as [Colormap] and click on [Setting] button.
Figure 434 shows an example of displayed contours for each [Display Setting] setting.
It is possible to visualize contours for multiple calculation results at the same time. To visualize multiple contours, please check on the check boxes for multiple items in the object browser.
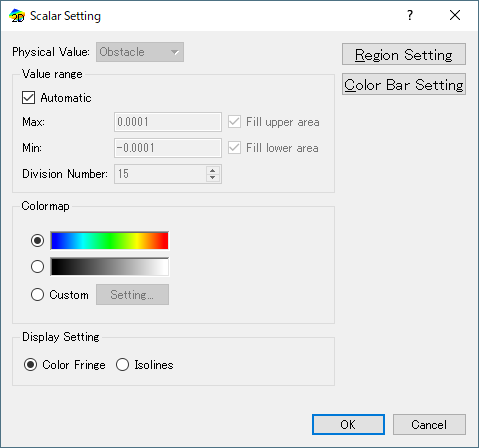
Figure 430 [Contour Setting] dialog
Figure 431 [Region Setting] dialog (Structured grid)
Figure 432 [Region Setting] dialog (Unstructured grid)
Figure 433 [Color Legend Setting] dialog
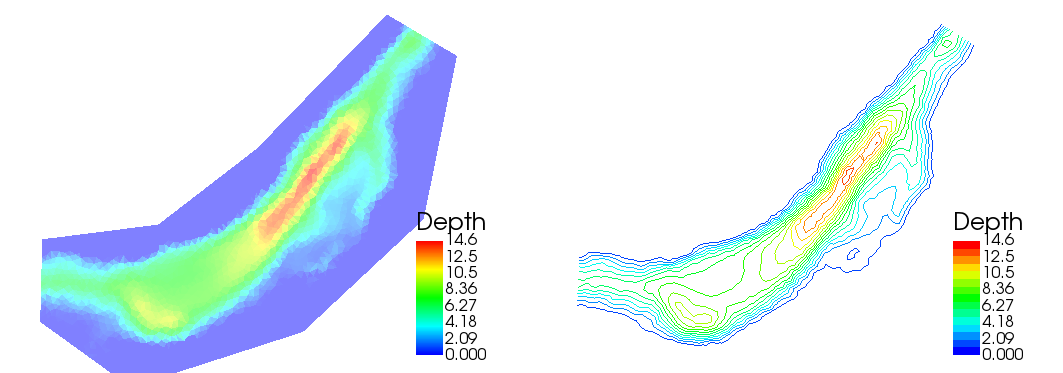
Figure 434 Examples of the contour display by the [Display Setting] setting
[Title] (T)
Description: Sets the title settings.
When you select [Title], the [Title Setting] dialog (Figure 435) will open. Set it and click on [OK].
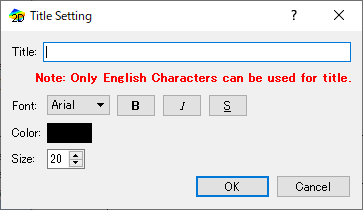
Figure 435 [Title Setting] dialog
[Time] (M)
Description: Sets the time settings.
When you select [Time], the [Time Setting] dialog (Figure 436) will open. Set it and click on [OK].
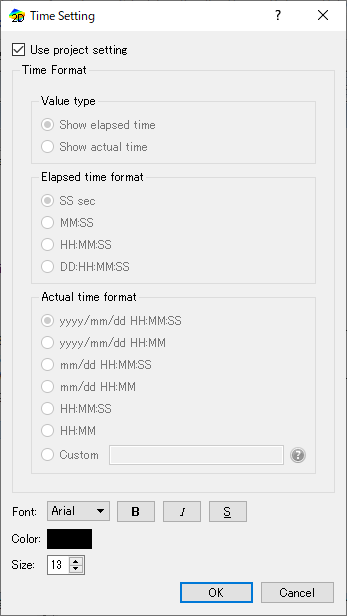
Figure 436 [Time Setting] dialog
[Background Color] (B)
Description: Changes the background color of the [Bird’s-Eye 2D Post-processing Window].
The function of this item is the same to that under [View] menu. Refer to [Background Color] (B).
[Z-direction Scale] (Z)
Description: Changes the scale factor in the Z-direction.
The function of this item is the same to that under [View] menu. Refer to [Z-direction scale] (Z).
Figure 438 shows an example of before and after changing Z-direction scale.
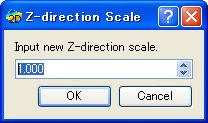
Figure 437 [Z-direction Scale] dialog
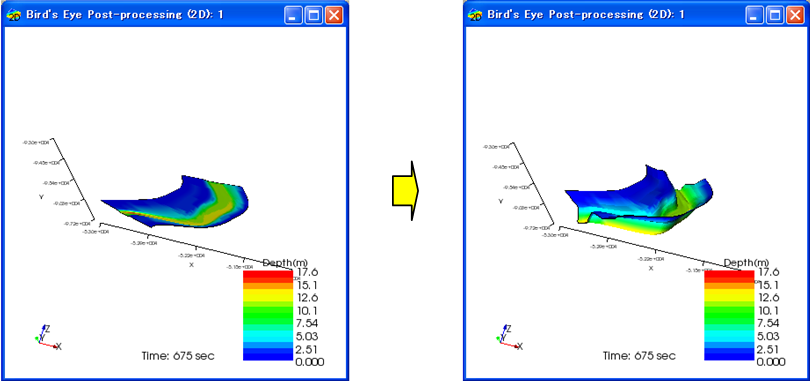
Figure 438 Example of changing Z-direction scalr