[Scattered Chart Window]
The functions for opening a scattered chart window are explained in this section.
[Open new Scattered Chart Window]
Either of the following actions opens a new graph window.
Menu bar: [Calculation Results] (R) –> [Open New Scattered Chart Window]
Operation Toolbar: ![]()
The [Data Source Setting] dialog (Figure 477) will open, so select the data to draw graph and click on [OK]. A new [Scattered Chart Window] window (Figure 478) will open that draws a scattered chart for the data you selected.
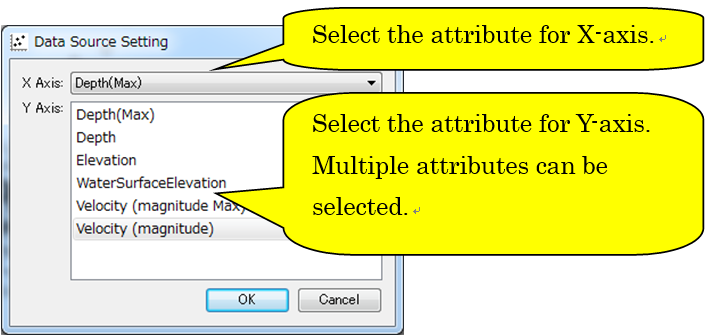
Figure 477 [Data Source Setting] dialog
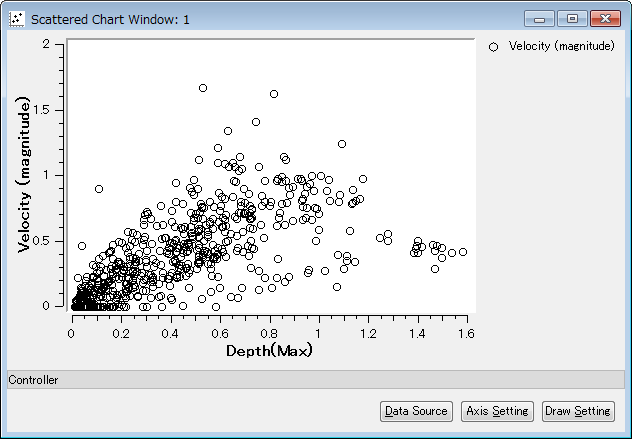
Figure 478 [Scattered Chart Window]
[Data Source Setting] (D)
Description: Set data source setting.
When you select this, the [Data Source Setting] dialog (Figure 477) will open. Modify setting and click on [OK].
[Axis Setting] (A)
Description: Set axis setting.
When you select this, the [Axis Setting] dialog (Figure 479) will open. Modify setting and click on [OK]. A new graph will be made according to the settings.
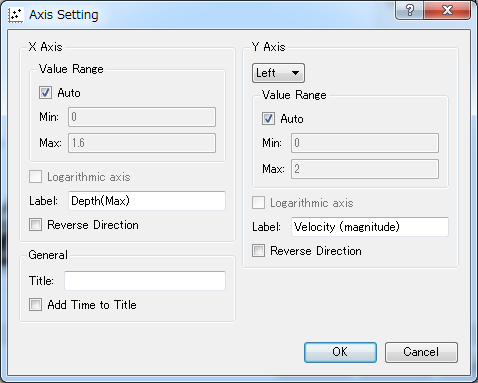
Figure 479 [Axis Setting] dialog
[Draw Setting] (D)
Description: Set the draw settings
When you select this, the [Draw Setting] dialog (Figure 480) will open. Modify setting and click on [OK]. A new graph will be made according to the settings.
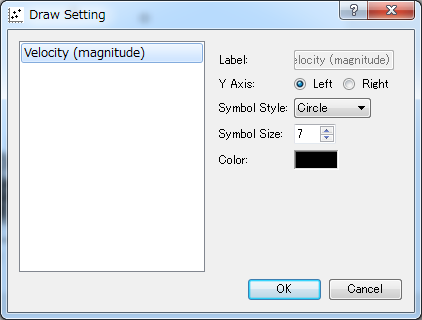
Figure 480 [Draw Setting] dialog